| TradeWithMe |
MY STYLE - BLOG
|
While I have worked with all kinds of charts that do not use time as a basis for plotting price action, its only recently that I started dabbling with Range Bars, only because limitations of representation and analysis on charting platforms.
Nicolellis range bars were developed in the mid 1990s by Vicente Nicolellis, a Brazilian trader and broker who spent over a decade running a trading desk in Sao Paulo. The local markets at the time were very volatile, and Nicolellis became interested in developing a way to use the volatility to his advantage. He believed price movement was paramount to understanding and using volatility. He developed Range Bars to take only price into consideration, thereby eliminating time from the equation. Nicolellis found that bars based on price only, and not time or other data, provided a new way of viewing and utilizing the volatility of the markets. Today, Range Bars are the new kid on the block, and are gaining popularity as a tool that traders can use to interpret volatility and place well-timed trades. Range bars take only price into consideration; therefore, each bar represents a specified movement of price. Traders and investors may be familiar with viewing bar charts based on time; for instance, a 30-minute chart where one bar shows the price activity for each 30-minute time period. Time-based charts, such as the 30-minute chart in this example, will always print the same number of bars during each trading session, regardless of volatility, volume or any other factor. Range Bars, on the other hand, can have any number of bars printing during a trading session: during times of higher volatility, more bars will print; conversely, during periods of lower volatility, fewer bars will print. The number of range bars created during a trading session will also depend on the instrument being charted and the specified price movement of the range bar. Three rules of range bars:
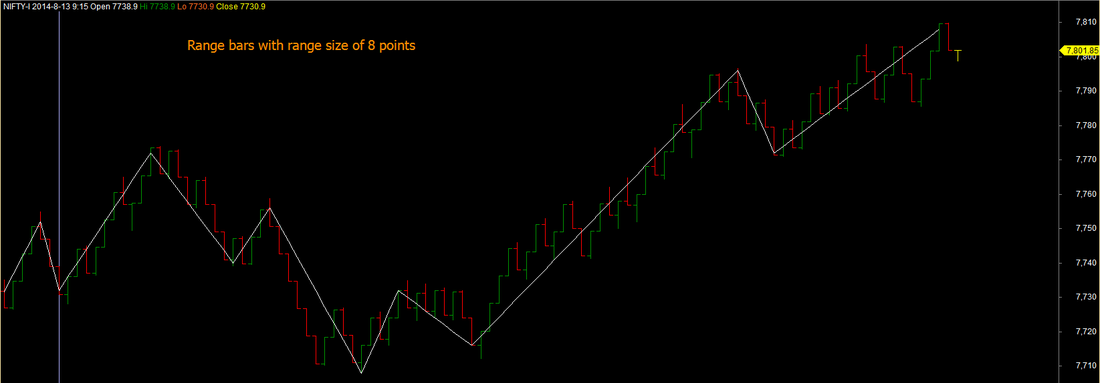
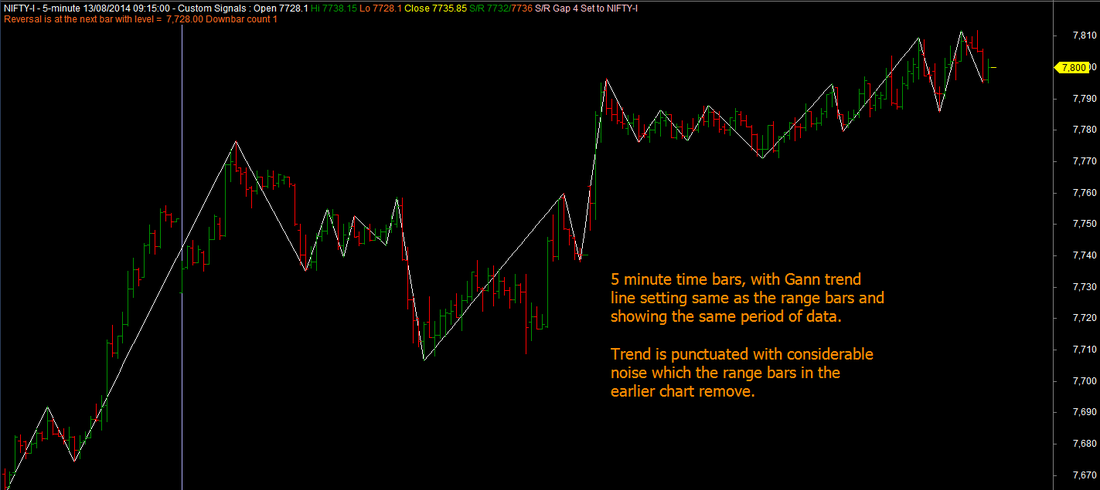
Cutting to the stark difference between range bars representation and time charts, see the charts for the Indian Nifty Futures charts for 13th August 2014, plotted with normal 5 minute time bars and Gann trend line and the same displayed in a range chart constructed with 1 minute time bars input. You can clearly see, how easy it is to recognise good swing trades here versus the compressed time frame chart, which gets vitiated by time based noise. This is another of the trading techniques that we are introducing in our mentored trading program.(click on the images to expand view)
2 Comments
I extensively use both Kagi and Point and Figure methods for my trading. The visual simplicity of Kagi has always been something that I like. However, the method doesnt provide the best way to detect changes in trend other than the usual Kagi reversal definition.
Its a known fact that Kagi,Renko and Point and Figure methods use the same underlying theory, but represent the data differently. By using Point and Figure theory, its easy to incorporate the 45 degree auto generated trend lines in Kagi charts. While Kagi charts already remove trend noise to a large extent, combining these with Point and Figure method of trend lines, produces amazingly simple and easy to interpret charts. See the example of BankNifty point and figure and Kagi charts with PnF style trend lines in the attached screenshots. First is the Point and Figure chart and below it the same data in Kagi with trend lines. Someone posted a blog comment requesting a good trading system.
That brought a smile. People still looking for silver bullets, the money spinning strategies that will make them successful. My advice to him and all other traders is simply to focus on consistent trading with a sound risk management for targets and exits. So whether its a trend following moving averages system or a proactive level based system like Murray Math or Camarilla, work on consistent trading. As examples, see the results of our own trading this month. Perhaps the best so far in our trading history. The only thing thats changed in what we do is simply trade the trades that our systems tell us to trade and use a sound risk management approach. Run trading like a business with similar rules and discipline, and you will never go wrong. And outside of this, be innovative. Here is just one example : Improve on the traditional Camarilla system by combining it with the Gann trend for example. And you will have a several fold increase in trading accuracy, as Gann trend identifies the trend changes more accurately than several other techniques, far quicker. See the conventional Camarilla chart for BankNifty and one with a Gann trend line. AFLs for both are available on the website. The current TradeWithMe forum is not so user friendly and interactive. A more contemporary forum website has been created and all posts from the current website transferred there. Traders are welcome to join that site and be part of a vibrant discussion forum.
http://tradewithme.freeforums.org Those mystical levels - Open Range, Camarilla, Gann, Fibonacci, Octaves, Murray Maths. Do they work?
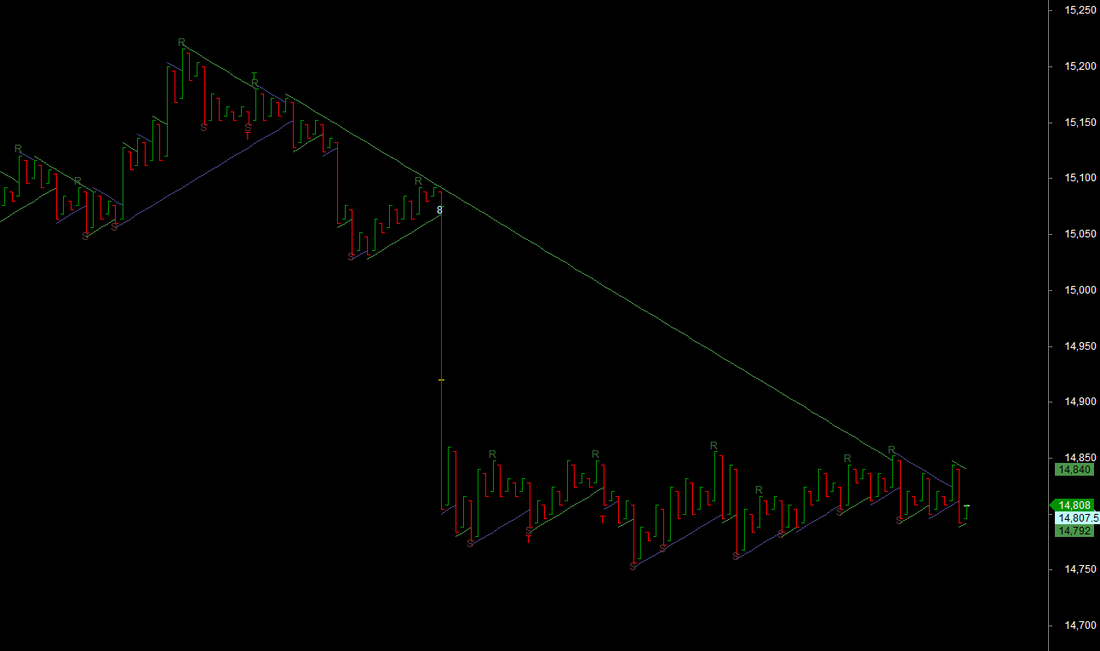
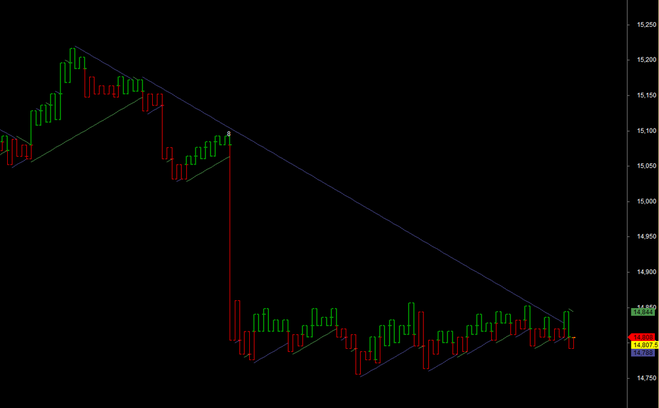
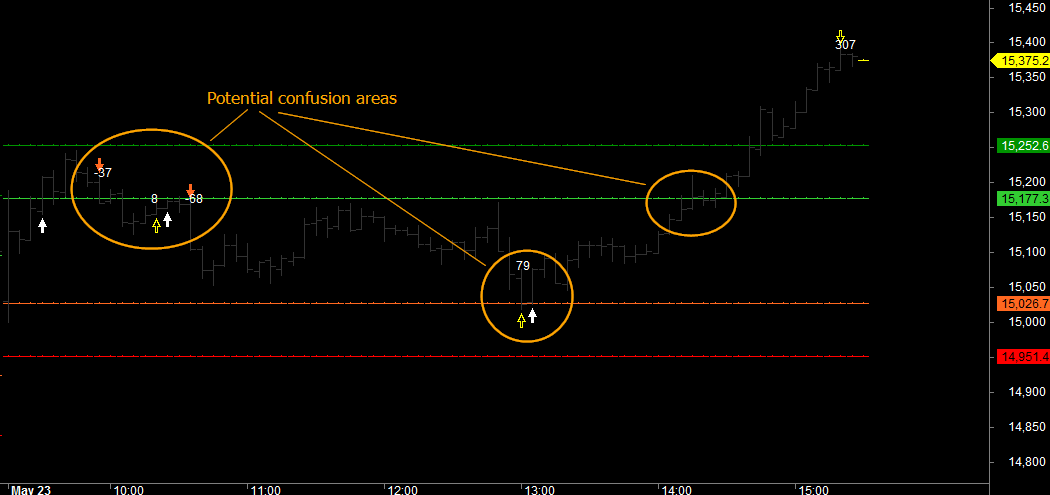
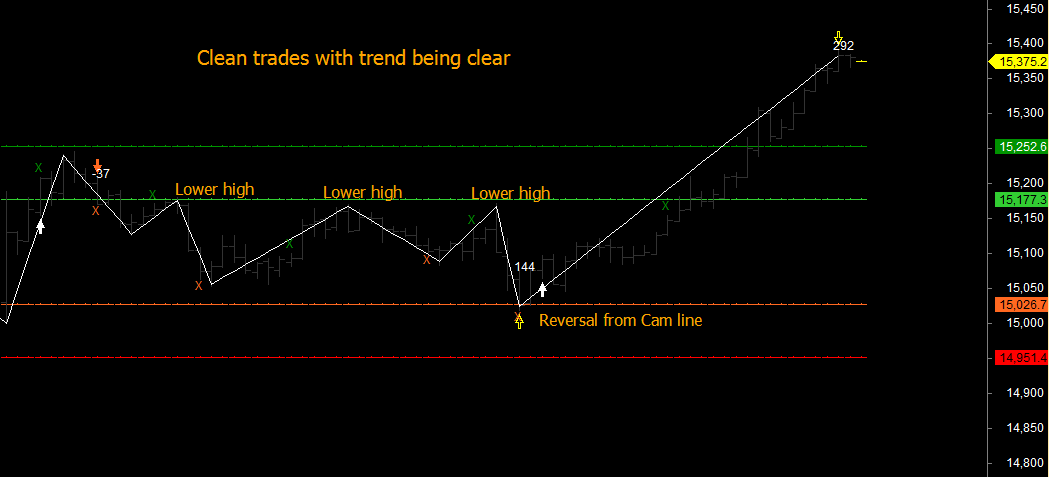
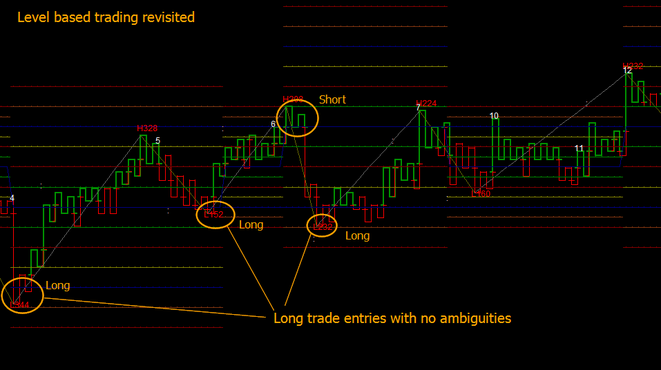
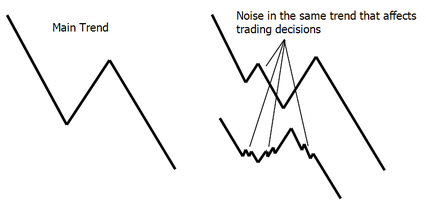
Yes, they do.. And Why? most of the time because, there are thousands of traders who believe in the sanctity of those levels and therefore, trade them like a self fulfilling prophecy. What is the real ball game? The answer is actually simple. Like any other trading method, level based trading approaches, offer a concept that is basically sound. Nearly all of them exploit the movement of the market around a golden mean: Think of a yoyo or trampoline. The harder you throw the ball or jump on the trampolene, the larger is the movement away from its on balance resting place. The markets work in exactly the same way. Finally, price returns to that golden mean and after some time creates a new wave of movement - repeating this cycle to eternity. Open range breakout works on breakouts from the golden mean. Camarilla exploits the deviations away from the golden mean - a reversal back or a breakout towards a new golden mean. Gann, takes the Camarilla concept to the next level - postulating constant multiple golden means cast in stone - around which price will oscillate, based on time movement. Fibonacci rules follow a more natural Newtonian law - what goes up comes down, and what goes down comes up. Murray maths and Octave based trading allow traders to trade from an extreme towards or away from the golden mean. Bollinger band trading allows traders to trade counter trend, when price moves more than 2 or 2.5 standard deviation width from the mean price movement. This thought is not about any of these methods, but about what is common amongst all of them. They present alternative methods for trading, which a trader can pick up and work with consistently, as they are following a natural movement which is unstoppable. A smart trader will learn to sync in with the rythm of these movements, a step, which we try to discover in our mentored trading offerings. However, most of this is common sensical knowledge, which a smart trader will learn to use : Buy when everyone is selling and Sell, when everyone is buying...... And dont trade when the market is trading around its golden mean. Isnt this simple....something that traders have spent centuries trying to do? And the answer is yes.............. THe example below is of a properly configured Octaves levels based trading system, which gives multiple long trades and a short trade. As it trades from Highs and Lows levels of the market, the failure level risk is consistently kept low. Just an idea sirji....! One of the major challenges that any technical trader faces is the removal of noise from price charts as these obscure and camouflage the underlying trend to force trades that fail. The current methods to handle noise vary from basic to sophisticated, but still do not help significantly especially in ranging periods where a smaller period noise interferes with the trend patterns. An example of smaller period noise is swing patterns within a larger trend as shown below, which is a very common occurence in markets: In the above examples the noise patterns are not exaggerated as they are in real markets. Some of the techniques that are used to remove noise are averaging price, using trend identifying methods like Heiken-Ashi and other similar approaches. Other alternatives are to use time-less charting methods like Point and Figure, Renko and Kagi or other proprietary methods. However, these methods do not handle lower order noise as shown above effectively, without significantly increasing trading risk.
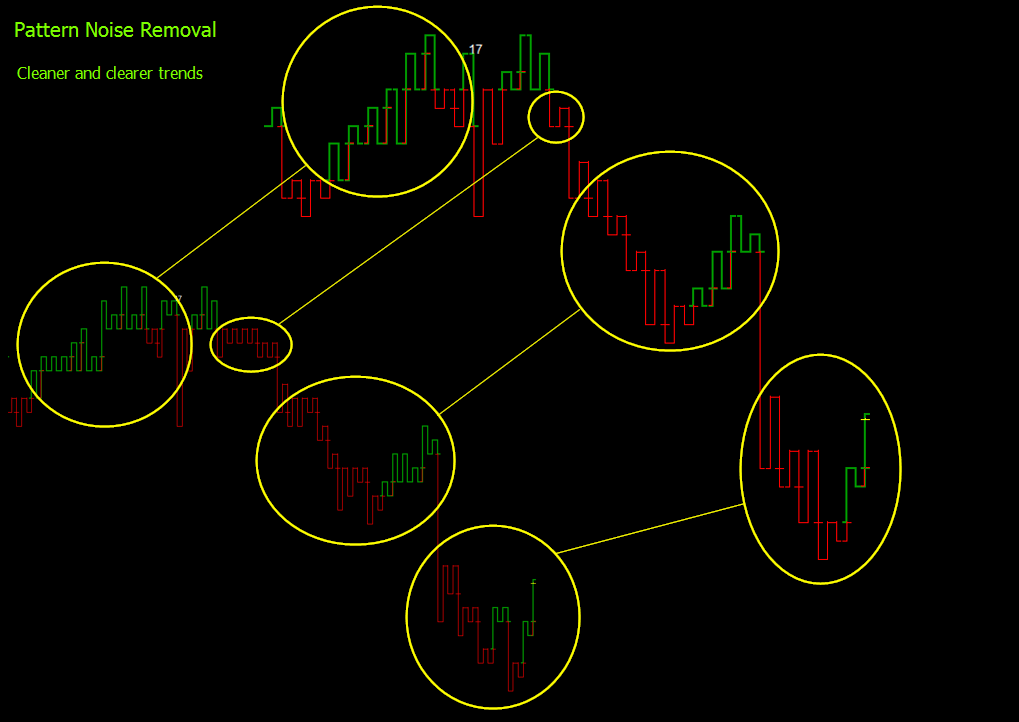
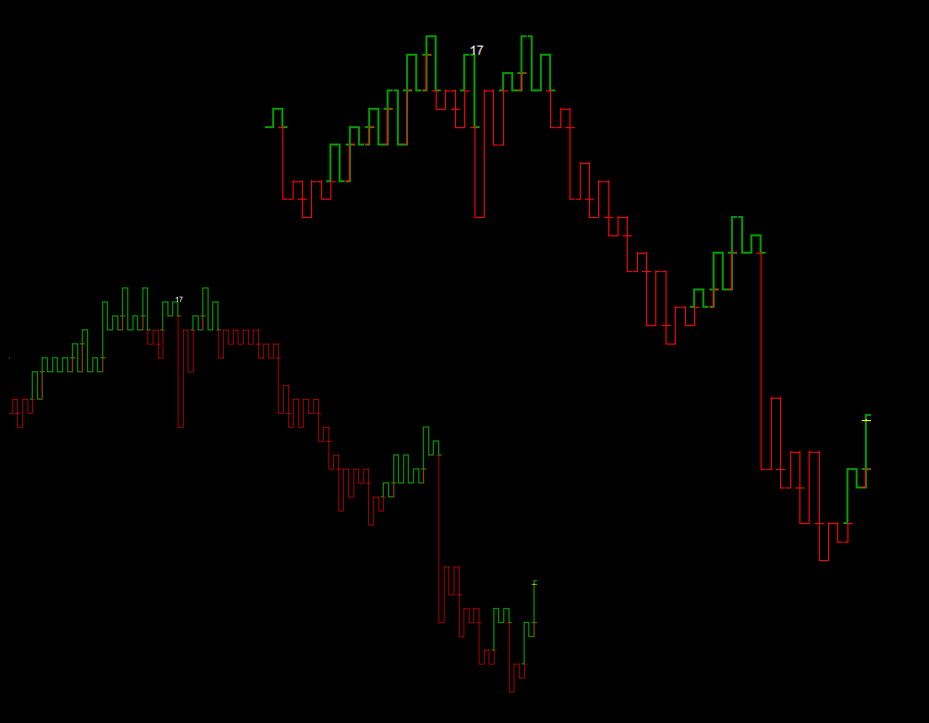
Another method to handle noise is to remove the spurious noisy patterns from the underlying data, before drawing the charts. This can lead to amazing clarity in the trends as is demonstrated in a noise removal technique used in a Kagi chart, as an example below in the two sets of images. The upper chart represents the same data but shows the underlying trend without any of the lower order noise. Another research innovation at TradeWithMe at work. Some times you get pleasantly surprised with the most unusual comments in the trading social network. I was busy trading on January 15 and I get few comments during the day, which made me feel that the journey that I set out (helping traders meet their financial objectives) on is meeting its objectives. Here are the comments from a couple of traders, received on my messenger (names masked) which simply got me a smile and cheer in an otherwise bright day :) :
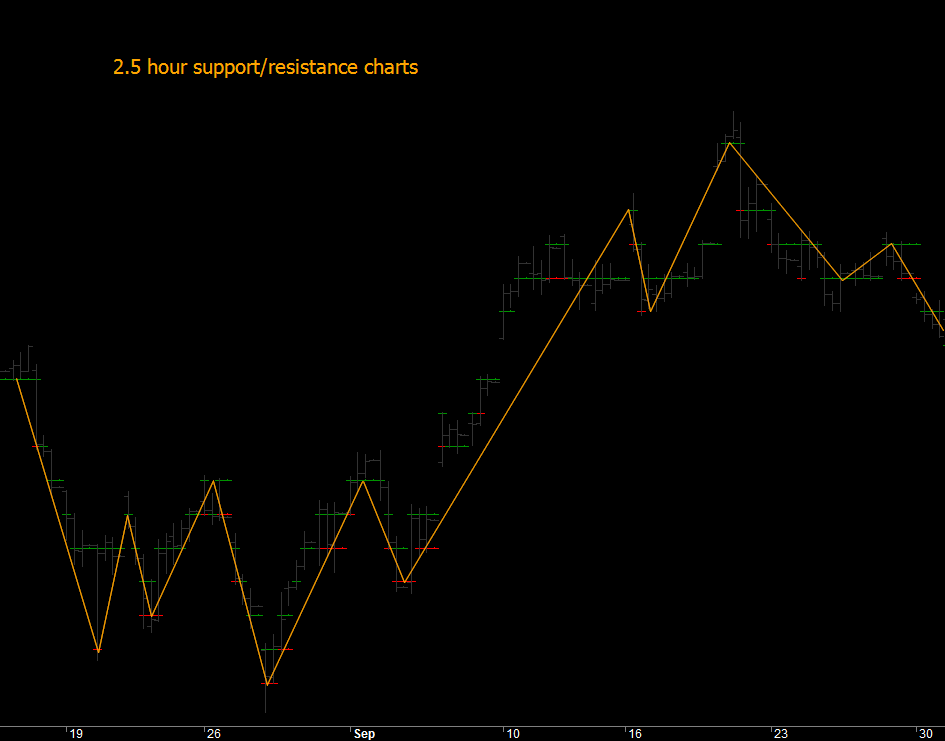
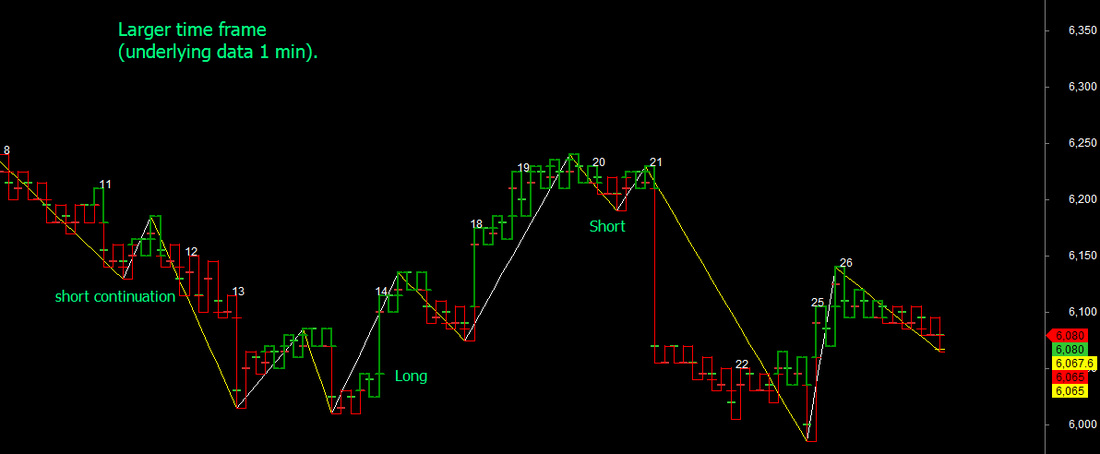
Quote Comment 1: dipxxz: i am not able to understand...i m watching a dream; is it real...sirji great sirji abnash: :) dipxxz: after joined with you sirji...i feel that mkt is not moving itself....you are operating....:) And a rejoinder from one of our traders : "bxxxxtrader : :)) i wonder what he'll say once he starts learning" Comment 2: belphexxxxxearch: ok belphexxxxxearch: long worked again sir :-) belphexxxxxearch: thnx abnash: Yes... abnash: :) belphexxxxxearch: u r a genius :-) Comment 3: Rxxxxxxa : Paisa vasool for us also :D (translation : 100% return on investment) Comment 4: (received on the blog comment - "Consistency In Trading", partly paraphrased for English corrections) Commodity Tips : I would want to thank for that efforts you've invested in this web page. I am hopeful that similar high-grade web posts are forthcoming in the future. Clothed in genuineness your imaginative writing skills has motivated me to achieve my own blog today. In fact your blogging is actually spreading its wings fast. You invent a sunny paradigm of it. Unquote I have never received such comments on my work, and I hope and wish that these and other traders who use the information on the website or tradewithme, get inspired and do well.  Check out details of this service which completes 6 months now. click this link. Read an interesting article by Niall Fuller on the traits of a crocodile and why we should adapt that into our trading strategy. 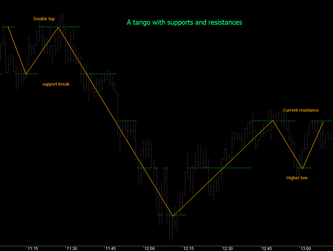 One simple way to trade is to identify supports and resistances and trade the trend based on them. An example of that is in the attached image. The way the supports and resistances are drawn as equidistant lines, immediately reveals the underlying trend eliminating noise. By using the supports and resistances as the basis to draw trend lines, rather than high-lows or close or averages, the trend becomes ordered and follows classical swing rules. The example on the left is drawn on 1 minute charts and the one below on 2.5 hour charts, showing how the approach is scalable. Just one of the innovations at work at TradeWithMe. 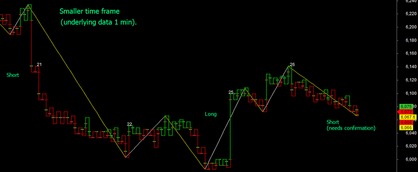 Most trading approaches use the immediate price movement patterns for trading decisions. While thats a good approach, such approaches can be difficult to manage if one does not look at multiple timeframes (for time based) and coarser views for non time based charts. One of our powerful trading methods which has been making trading more efficient in the recent days is an application of Kagi chart principles along with core Renko/Point and figure methods, resulting in a completely new chart that is different from both PnF, Renko and Kagi, though it looks like the latter. Combined with a trend recognition method thats amazingly simple but effective, results in extreme noise cancellation and a significant reduction in ineffective trades. This results in charts that effectively get closer to mechanical trading. An example is shown in the chart along side, where we have plotted the trend for NIFTY futures for intraday and positional trades. And the best part is that the core data for these charts is 1 minute time frame data demonstrating again that intraday and positional trades can be initiated from the same charts. This effort is part of the ongoing effort to simpler and more effective trading at TradeWithMe. Notice that each vertical bar in the chart may hold a few minutes, few hours or few days of data seamlessly. The bar patterns themselves have a story to tell and can be used in conjunction with the trend line. There are no ranging zones on the charts as these have been effectively filtered out by the charting technology. There is also zero lag in pattern formation as the data source is 1 minute data and no price derivatives used. One may argue that you dont need 1 minute data, however, when event based price movements occur, these are invaluable. I dont yet have access to tick data to experiment, so cannot comment on how the charts woud perform with that data source. The addon sophistication of swing logic, fib retracements etc. are other tools that one can use here without worrying about chart responsiveness. (click images for a larger view) |
AuthorAbnash Singh, Am a Trader helping small traders to realize their dreams. Archives
October 2017
Categories
All
|
|
Want more information ? Get in touch with us through the contact form : (click here)
|
|
 RSS Feed