12. WD Gann and his mystical levels! - Some new approaches
To most of the technical analysts and financial traders, the name, William Delbert Gann, is well-known. Gann was one of the greatest traders in the early twenty centuries, who has extremely arcane trading analysis techniques and methods that based on ancient mathematics and geometry. Yet, as it was never unveiled explicitly, the theory of Gann is admired by most, but grasped by few. In this section we explore practical but effective ways of trading using Gann levels, how to develop trading levels and follow it up with practical examples of implementing them in a trading system implemented on Amibroker.
W. D. Gann was born in an Irish family in Lufkin, Texas in the United States on 6 June 1878. His parents are devoted Christians with a strong Methodist background. W. D. Gann was himself a devoted Christian. He claimed that his market cycle theories were discovered from the Holy Bible.
The home country of Gann was a cotton land, the influence to the childhood of the great trader was understandable. With Gann was 24 in 1902, he made his first trade in cotton futures contract and enjoyed the profit from trading. The 53 years of trading hereafter, it was said that he had gained US$50 million from the market. The wealth of that scale compared with the purchasing power at his time was, in deed, very substantial.
Read more and the rest of this article at Acrotec.com - Gann Resources - All of the above paragraph is credited to that site.
Caution: Gann lines are a set of support and resistance lines and like any such line are NOT predictive. Which means that when you trade with these lines, there is a risk inherent in the trade, which is mitigated by the "likelihood" of price moving through or away from the level. Hence, any trading strategy based on Gann levels must have a strong risk management or stop loss overlay to avoid losing capital
How Does Gann Trading Theory Work?
Gann Theory uses three indicators - pattern, price and time to project changes in trend and market direction. These indicators exert their influence individually with one or the other being more determinate under different conditions. The Gann Trading Theory is based on the fact that specific geometric price patterns and angles have special properties that can be used to predict future prices.
Gann’s Theory suggests that a current cycle can be proven to be in existence by past market performance and the geometric proportions of the cycle as a whole. Gann referred cycles as being 360 degrees or 100% in total, and he divided these cycles into thirds and quarters. E.g. 25% (90*), 33.3% (120*), 50% (180*), 66.6% (240*), 75%(270*), 100%(360*). He considered 50% (180*) and 100% (360*) as the most important points to watch.
One way of qualifying a high like this using Gann theory is to work backwards from this point to see if there are any significant cycles in place identifying previous turning points. This in turn will validate the current high as well as predict future dates to watch.
Gann Square of 9
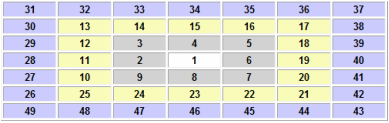
The Gann Wheel, what most people probably think of as the Square of Nine, is sometimes called a "Square Root Calculator" a Pivot Calculator or a device that "Squares the Circle." This simple illustration may explain how and why these terms came about. You probably recognize that the illustration is just the first few rings of a Gann Wheel with the numeral "1" at the center.
In Square of Nine parlance we say things like 19 is 90 degrees from 15. That makes sense only if you can visualize that this rectangular table of numbers is enclosed in a circle (or series of circles) of 360 degrees. In this case, the number 19 is 1/4 the way around the circle from the number 15, or 90 degrees in circumference from 15. The number 34 is directly above the number 15 and positioned one circumference or one ring outside the circle that contains the number 15. In the same sense that we can say that 19 is 90 degrees from 15, we can say that 34 is 360 degrees from 15, or one complete rotation of the circle from 15. That explains where squaring the circle comes from. A more accurate expression would be that we're circling the square but that never did catch on.
Read more about this at - Trading Fives from where this paragraph is acknowledged and fully credited.
Read more also at Forexpros
More links will be added here...
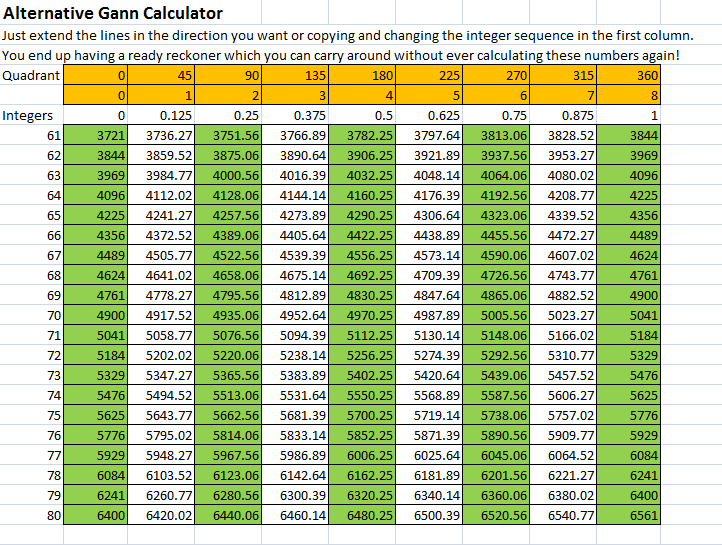
12.1 Gann Calculator - A new way of looking at the calculator
All that you want to know about the Gann Calculator is enclosed in the article by Saurabh Gandhi at his site Pivot Trading. And attached below for your reference. Full credit to him for compiling this reference. Also attached is the Gann Calculator.
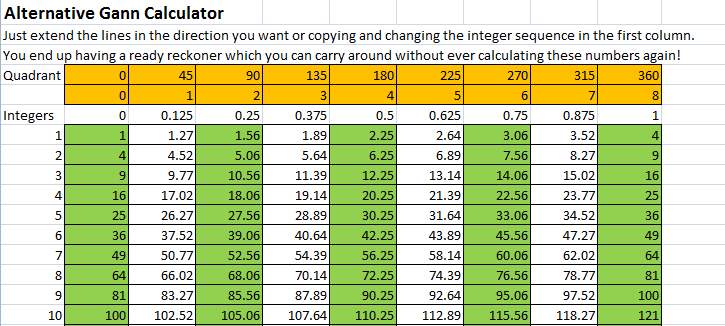
See the alternative Gann Calculator that I developed. It shows the Gann quadrants and the Gann levels as a sequential buildup. The good thing is that you can just print any segment of levels, those below are for the Nifty and carry them around, if you like for your trading convenience. See the second sample below.
13-11-2011 Also included now an alternative submission of Gann and Murrey level calculator - Enthios version.
| saurabh_gann.pdf |
| ganncalculatorunlocked.xlsx |
| gann_calculator_new_abnash.xlsx |
| gann_-_enthios_calculator.xls |
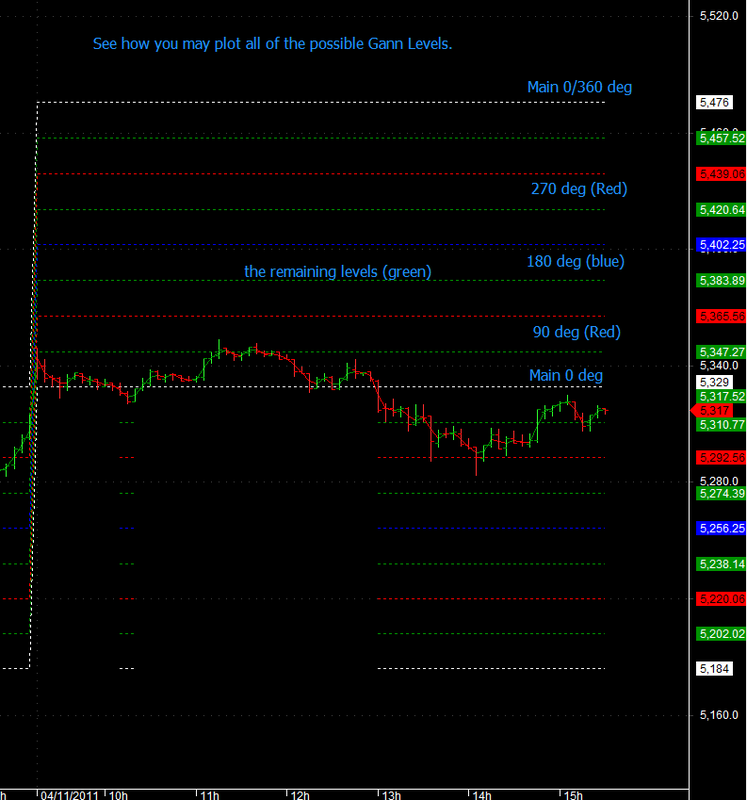
12.2 Gann Levels - Use them differently
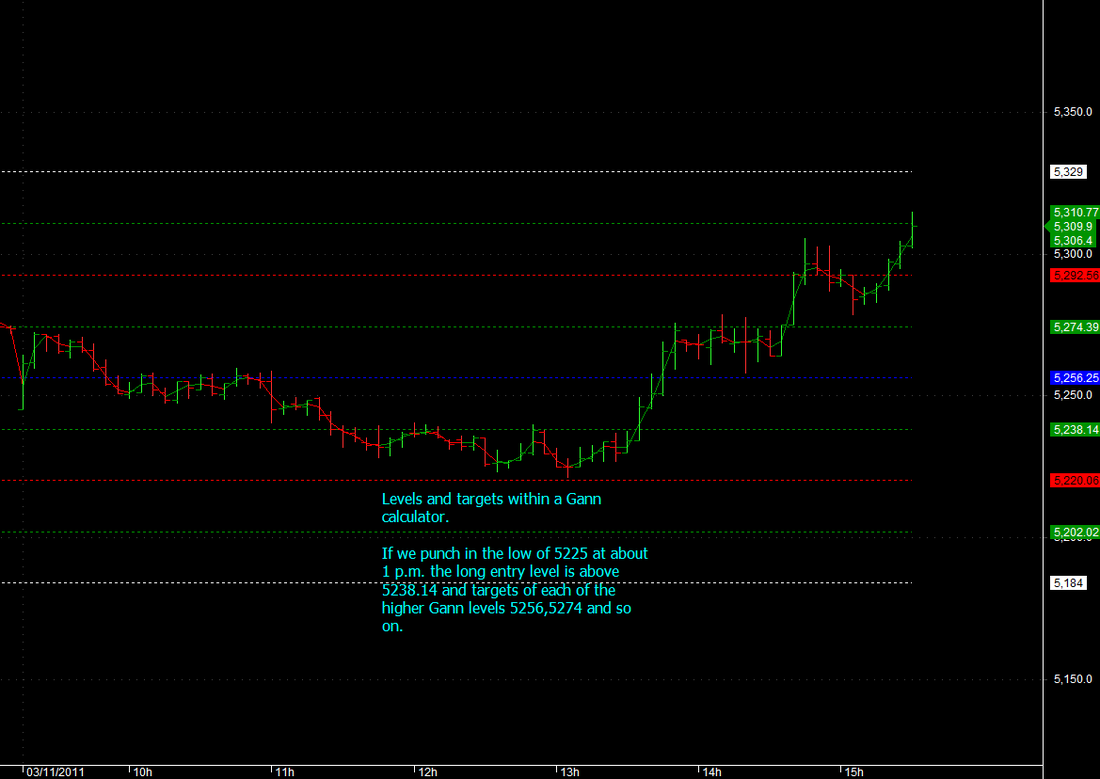
The Gann calculator will give you the levels you see on the right and which arealso plotted as lines on this price chart.
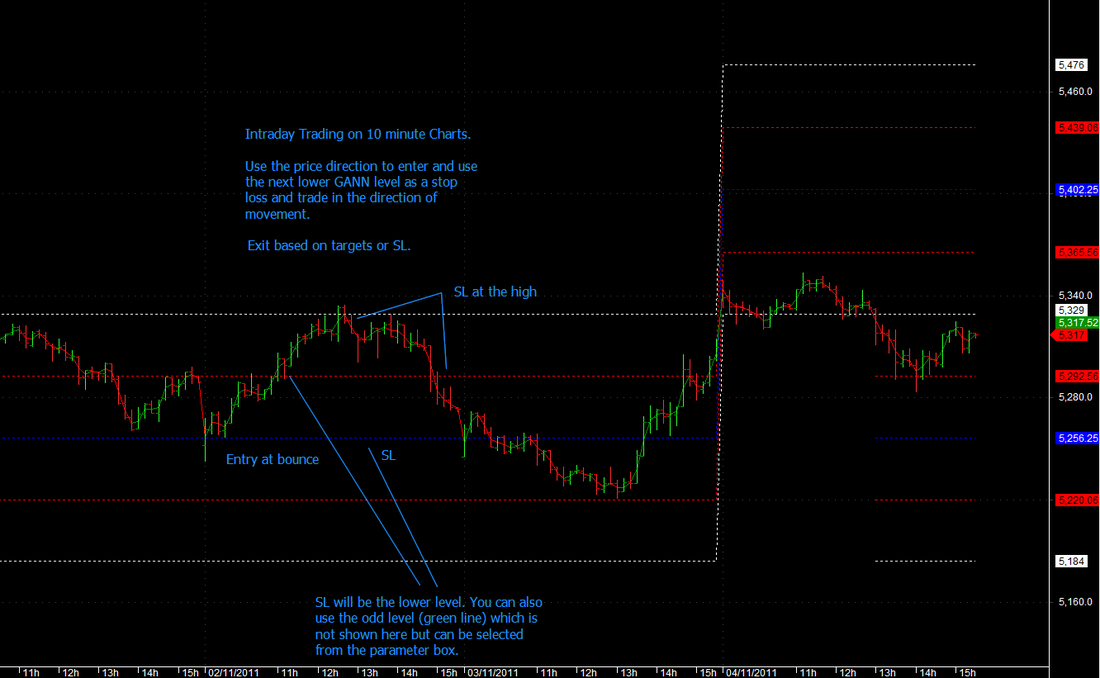
Lets say at 1 pm, you punched in 5225 in the Gann calculator. What it will give is a buy above 5238 with a target just below the next Gann line which is 5256. Thats approx 18 pts away. The next target is just below the following Gann line 5256 and similarly the higher levels. Instead of using the calculator blindly, would you not consider trading with the trend till a reversal occurs. Maybe use, a lower Gann line as a stop loss and the next higher level as the next target?
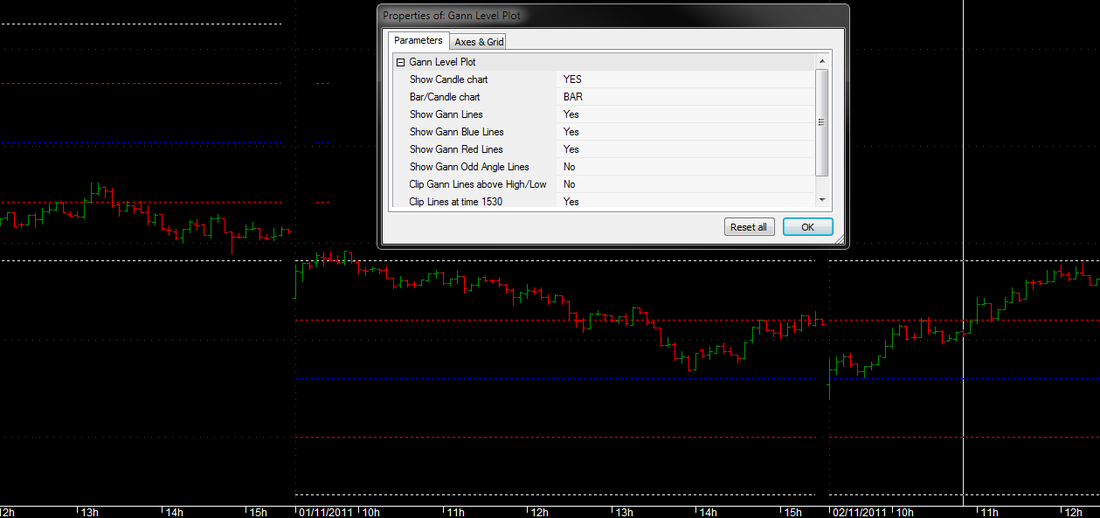
So you want to plot those levels and throw away the Gann calculator? Go right ahead and use the AFL attached below. Unless stated, all AFL's here are original work.
The AFL attached allows you extremely flexible plotting of the Gann levels. You may plot just the main levels (0/360 for example) or all of the levels as shown above. To prevent clutter,you can suppress print at 15:30 so that date change over doesnt cause the graphs to clutter up. There is also a proximity detector, i.e. when price is close to a Gann level. All of these can be setup in the parameters window.
Update of 12-11-2011: Based on Gann Level plot options that you choose, now shows the nearest upper and lower Gann levels which may be used as trading targets. Also shows days highs and lows.
Update of 12-11-2011: Based on Gann Level plot options that you choose, now shows the nearest upper and lower Gann levels which may be used as trading targets. Also shows days highs and lows.

| gann_levels_plot_with_targets_and_day_highlow.afl |
12.3 The Gann Fan
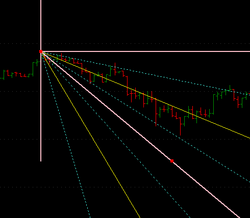
The Gann Fan or Gann Angles concept is based on the ideal balance between time and price exists when prices move identically to time, which occurs when the Gann angle is at 45 degrees. In total, there are nine different Gann angles that are important for identifying trend lines and market actions. When one of these trend lines is broken, the following angle will provide support or resistance.
Read more: http://www.investopedia.com/terms/g/gannangles.asp#ixzz1cnP7laWC
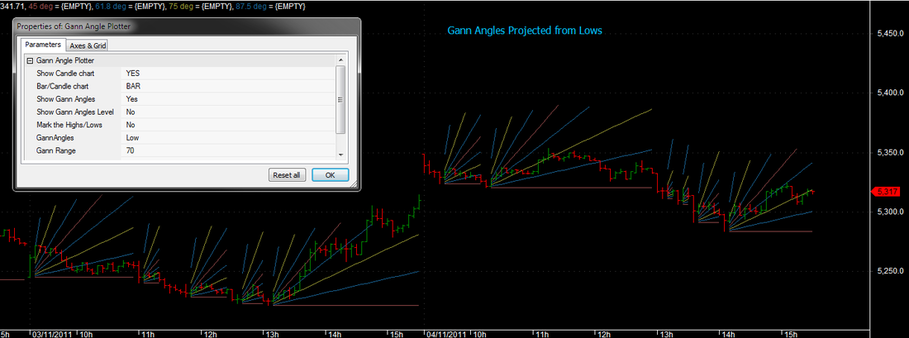
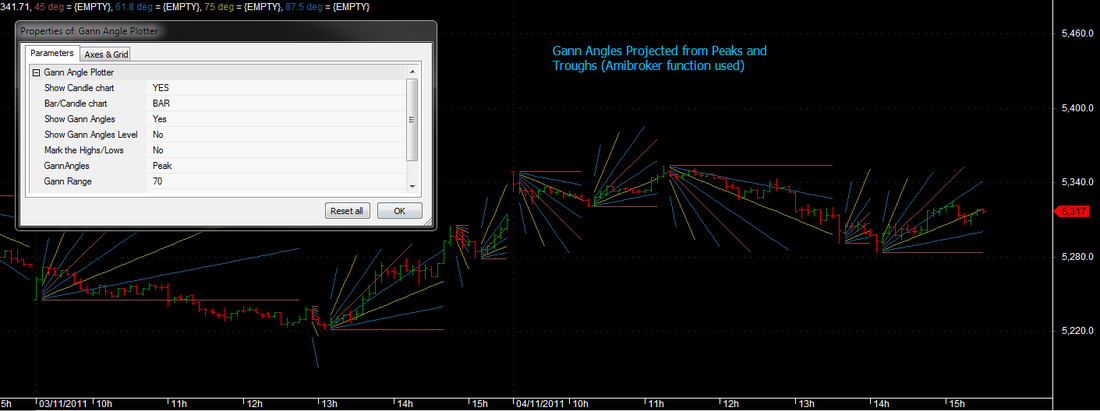
Generally speaking, you will draw these lines in a 1:1 proportion of time and price to get the right proprotion of the angles and therefore the supports and resistances. In Amibroker, you can use the Gann Angle tool, but you may mess up on choosing the right proportion and therefore may be off on your projections.
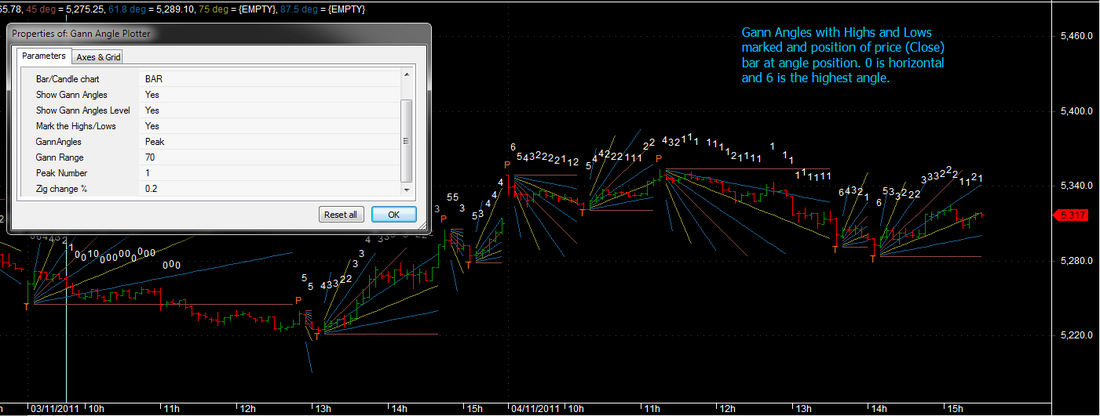
Enclosed below is an AFL which projects Gann angles on minute charts. A version suitable for other time frames will be developed on request. The AFL allows you to project from Highs or Lows or both. The last function has a limitation that it uses the Amibroker Peak/Trough functions which detect peaks and roughs only after the passage of 4-5 bars from the occurence. The High and Low projections do not have this limitation. For trading purposes, you can also view where price is closing at each bar. For this purpose, angles are numbered from 1-6 starting from 0 being the horizontal.
If you have any suggestions, please write to me at [email protected]
Gann plotter updated to allow it to be used for all types of scrips. There may be exceptions, as it is not tested accross all value ranges.
Read more: http://www.investopedia.com/terms/g/gannangles.asp#ixzz1cnP7laWC
Generally speaking, you will draw these lines in a 1:1 proportion of time and price to get the right proprotion of the angles and therefore the supports and resistances. In Amibroker, you can use the Gann Angle tool, but you may mess up on choosing the right proportion and therefore may be off on your projections.
Enclosed below is an AFL which projects Gann angles on minute charts. A version suitable for other time frames will be developed on request. The AFL allows you to project from Highs or Lows or both. The last function has a limitation that it uses the Amibroker Peak/Trough functions which detect peaks and roughs only after the passage of 4-5 bars from the occurence. The High and Low projections do not have this limitation. For trading purposes, you can also view where price is closing at each bar. For this purpose, angles are numbered from 1-6 starting from 0 being the horizontal.
If you have any suggestions, please write to me at [email protected]
Gann plotter updated to allow it to be used for all types of scrips. There may be exceptions, as it is not tested accross all value ranges.

| gann_angle_plotter.afl |
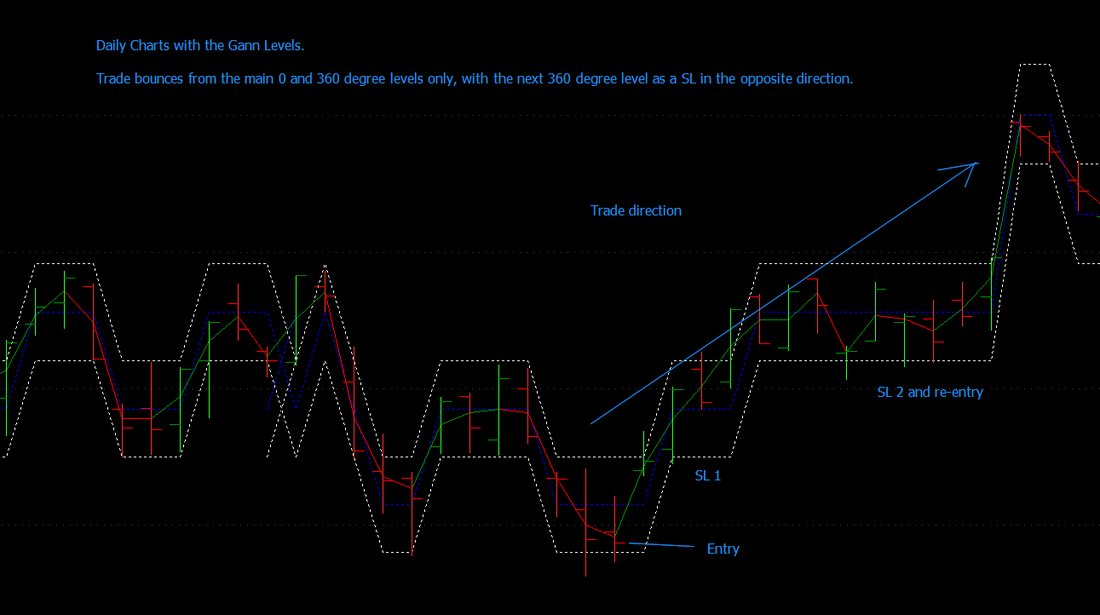
12.4 Trading with Gann Levels
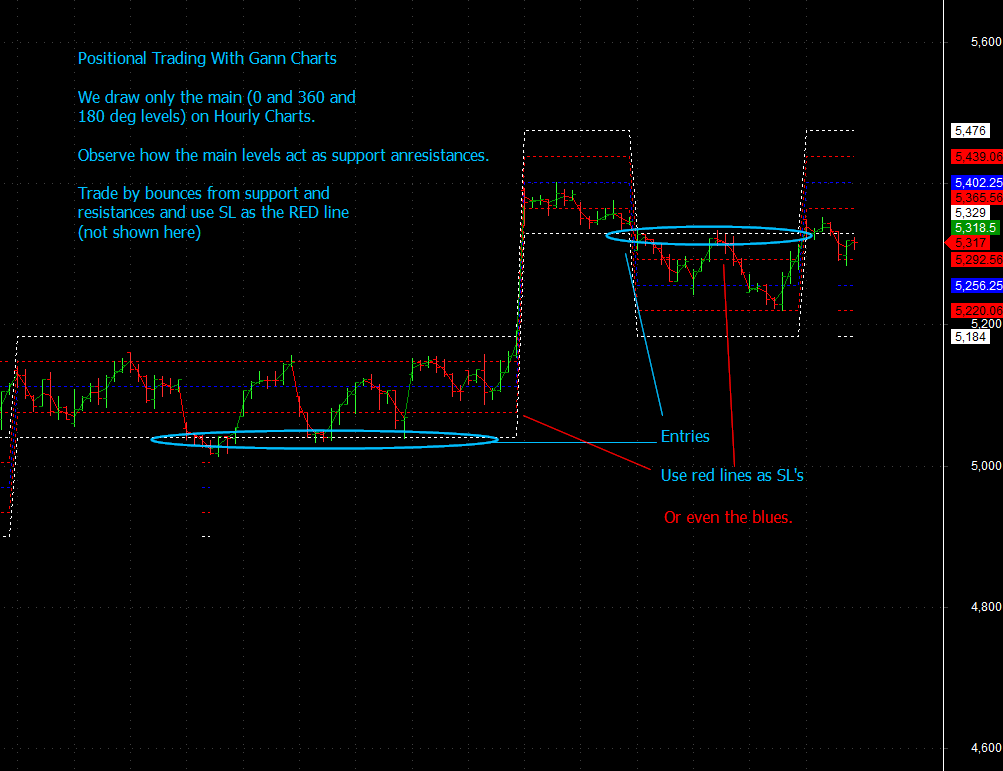
You can trade all levels intraday, short term positional and positional with Gann levels. See the charts below.
Caution: Always ensure stop losses are in place, as Gann levels are only supports and resistance and do not have predictive capability!
Check out the implementation of Gann trading on Point and Figure charts in section 15. Click here.
Caution: Always ensure stop losses are in place, as Gann levels are only supports and resistance and do not have predictive capability!
Check out the implementation of Gann trading on Point and Figure charts in section 15. Click here.
12.5 Gann 2 bar Swing Charts
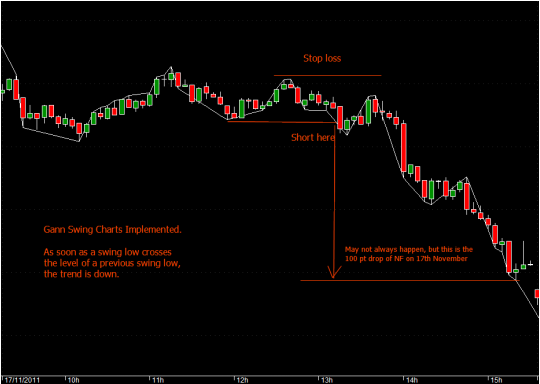
Gann 2 bar swing charts are a great way to catch trend changes and follow them, ignoring the noise that normal swing charts generate. Logically, these are placed in the Swing trading section at sub sections 14.9 and 14.10 along with the relevant AFL.
12.6 Square of Nine AFL
Check the AFL library.http://www.tradewithme.me/afl-reference-library.html
Should you have any suggestions or contributions, please write to me at [email protected] or post you comments in the forum
or at http://www.inditraders.com/technical-analysis/5434-learn-technical-analysis.html
Should you have any suggestions or contributions, please write to me at [email protected] or post you comments in the forum
or at http://www.inditraders.com/technical-analysis/5434-learn-technical-analysis.html
12.7 More on Gann Trading
Inviting readers to contribute their experiences to increase the wealth of the trading community. I will be adding more soon!