4. Supports & Resistances
Updated 12th August 2014
Support and resistance is one of the most widely used concepts in trading. Strangely enough, everyone seems to have their own idea on how you should measure support and resistance.
Let's take a look at the basics first.
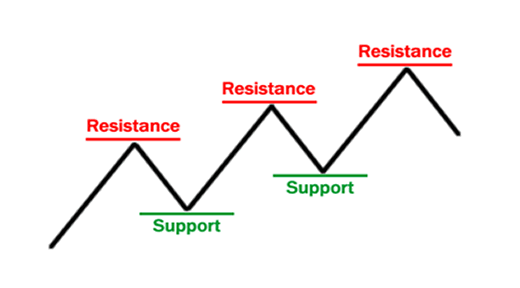
Look at the diagram below. As you can see, this zigzag pattern is making its way up (bull market). When the market moves up and then pulls back, the highest point reached before it pulled back is now resistance.
As the market continues up again, the lowest point reached before it started back is now support. In this way resistance and support are continually formed as the market oscillates over time. The reverse is true for the downtrend.
As you can see, this zigzag pattern is making its way up (bull market). When the market moves up and then pulls back, the highest point reached before it pulled back is now resistance.
As the market continues up again, the lowest point reached before it started back is now support. In this way resistance and support are continually formed as the market oscillates over time. The reverse is true for the downtrend.
How are supports and resistances used for trading ? Several ways:
- Pull back trading. On each pullback from a newer high and low for example for long trades and the converse for shorts.
- Support or resistance break. When price crosses the boundaries of the supports and resistances, these levels are said to breached and its possible to trade these breakouts.
Supports and resistance trading needs to be combined with view of the larger market to be effective. These remain the most effective and powerful methods for successful trading.
Improperly used, the use of this approach can cause a serious dent in your trading account. Read more about these in the separate subsection for this concept.
Read more: http://www.babypips.com/school/support-and-resistance.html#ixzz1bxlk5CJm
4.1 Plotting Support and Resistance
One thing to remember is that support and resistance levels are not exact numbers.
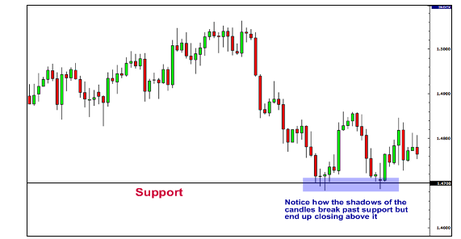
Often times you will see a support or resistance level that appears broken, but soon after find out that the market was just testing it. With candlestick charts, these "tests" of support and resistance are usually represented by the candlestick shadows.
Notice how the shadows of the candles tested the 1.4700 support level. At those times it seemed like the market was "breaking" support. In hindsight we can see that the market was merely testing that level.
So how do we truly know if support and resistance was broken?
There is no definite answer to this question. Some argue that a support or resistance level is broken if the market can actually close past that level. However, you will find that this is not always the case.
Please rest of this article at the source site:
Read more: http://www.babypips.com/school/support-and-resistance.html#ixzz1bxm2ptox
Other resources:(credits to all the respective websites).
http://stockcharts.com/help/doku.php?id=chart_school:chart_analysis:support_and_resistan
http://www.investopedia.com/articles/technical/061801.asp#axzz1bxdqcLO6
http://www.marketskillbuilder.com/support.htm
http://en.wikipedia.org/wiki/Support_and_resistance
4.2 Trend Lines:
Trend lines are probably the most common form of technical analysis. They are probably one of the most underutilized ones as well.
If drawn correctly, they can be as accurate as any other method. Unfortunately, most traders don't draw them correctly or try to make the line fit the market instead of the other way around.
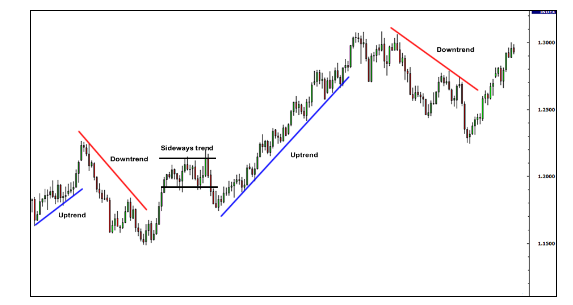
In their most basic form, an uptrend line is drawn along the bottom of easily identifiable support areas (valleys). In a downtrend, the trend line is drawn along the top of easily identifiable resistance areas (peaks).
Warning : Fitting trend lines after the fact and in the live markets are completely different activities. After the fact drawing of trend lines or even supports and resistances is like looking into the future, which is not possible in the live markets. So devise your rules for supports and resistances and trend lines and use them effectively.
Explore : Point and Figure and Kagi methods for trading. These can help you to draw symmetric trend lines that are not prone to judgement error and therefore are effective for trading.
Issue: Point and Figure, Renko and Kagi are not well support in most charting software. No answers to that yet. As part of the mentored trading program, some of the platforms developed in Amibroker are provided to overcome this issue. These are exclusive and not available anywhere else.
Read the rest of the article at: http://www.babypips.com/school/trend-lines.html#ixzz1bxqRor1e
If drawn correctly, they can be as accurate as any other method. Unfortunately, most traders don't draw them correctly or try to make the line fit the market instead of the other way around.
In their most basic form, an uptrend line is drawn along the bottom of easily identifiable support areas (valleys). In a downtrend, the trend line is drawn along the top of easily identifiable resistance areas (peaks).
Warning : Fitting trend lines after the fact and in the live markets are completely different activities. After the fact drawing of trend lines or even supports and resistances is like looking into the future, which is not possible in the live markets. So devise your rules for supports and resistances and trend lines and use them effectively.
Explore : Point and Figure and Kagi methods for trading. These can help you to draw symmetric trend lines that are not prone to judgement error and therefore are effective for trading.
Issue: Point and Figure, Renko and Kagi are not well support in most charting software. No answers to that yet. As part of the mentored trading program, some of the platforms developed in Amibroker are provided to overcome this issue. These are exclusive and not available anywhere else.
Read the rest of the article at: http://www.babypips.com/school/trend-lines.html#ixzz1bxqRor1e
4.3 Advanced Trendline AFL
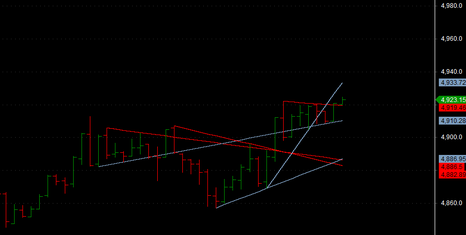
See item 15.11 in the AFL library to get this AFL or click this link - Advanced Trendline AFL. This AFL allows you to draw all kinds of supports and resistance lines using low to low or high to low or low to high and more....... Explore it to check out the trends described in this section.