19. Trading Systems VIII - Developing your Stop loss rules
19.1 Stop losses and Targets
No trading system will deliver profits unless you have an appropriate exit strategy combined with your risk management and trading rules.
Having searched over the web, I could not see any significant methods shared by any of the experts and lot of comments are vague and not objective.
So let me try to put together some of the methods that I have come across and have used in my trading journey. This section is work in progress as I expect a lot of new material to surface.
This section tries to give an insight on different approaches to implementing stop loss rules into your trading systems.
Stop losses should be combined with your risk management approach to prevent unusually high risks to be taken. We touch on this at the end of this section.
Section still under development.
19.1 What is a stop loss?
A stop loss is simply a price point in the negative direction of your trade which is the no regrets exit for your trade if it doesnt go in a profitable direction. The stop loss point should not be so close to your trade that normal "vibrations" of the market happen to take it out, and you see the trade moving in a profitable direction. The stop loss point cannot be so far off from your trading entry level, that should it hit, it causes a severe damage to your trading account.
19.2 Fixed stop loss
This is the easiest concept in managing a stop loss. You decide that you will not risk more than x% of your trading capital and coupled with your position size, you can calculate the stop loss per trade that you will accept. This for example, if you say that you trade 2 lots of Nifty Futures where the margin requires is Rs 40000 (say). Each lot is 50 units, and each point movement = Re 1. 3% of trading capital = Rs 1200. So for 2 lots the stop loss that you are willing to bear is Rs 1200/(2 x 50) = 12 points. Now you say that this is neat and fine. The issue is that the markets volatility keeps changing, and therefore, there will be times, that such stop losses will be blown out in seconds of entering a trade. As a corollary to this, you can vary the position size to deepen or decrease the stop loss level. Say, for the same risk Rs 1200, you decide that you will trade only 1 lot. Then the stop loss limit increases to 1200/50 = 24 points.
See Figure 1 below. The first pictorial is the happy situation and the second is the not so happy situation. Get the idea?
Fixed stop losses will work fine, if you link them with market volatility either subjectively or objectively. You can index the stop loss, for example, if you use a 12 point stop loss, and volatility is 15%. Set that as the base. If volatility increases to 20%, then the indexation is simply 20/15= 1.3, and your new stop loss is 12x 1.3 = 15.6 points. Manage your position size and risk appropriately.

19.3 Variable Stop loss
Indexation is just one approach to manage the fixed stop loss described above. A second method to look at stop losses as to take into account the current intrinsic price movement variations in your time period of reference and use that as a stop loss. For that, the average traded range or ATR is a good measure of the price variation at the moment. See the example below (AFL also attached below).
| sl-atr.afl |
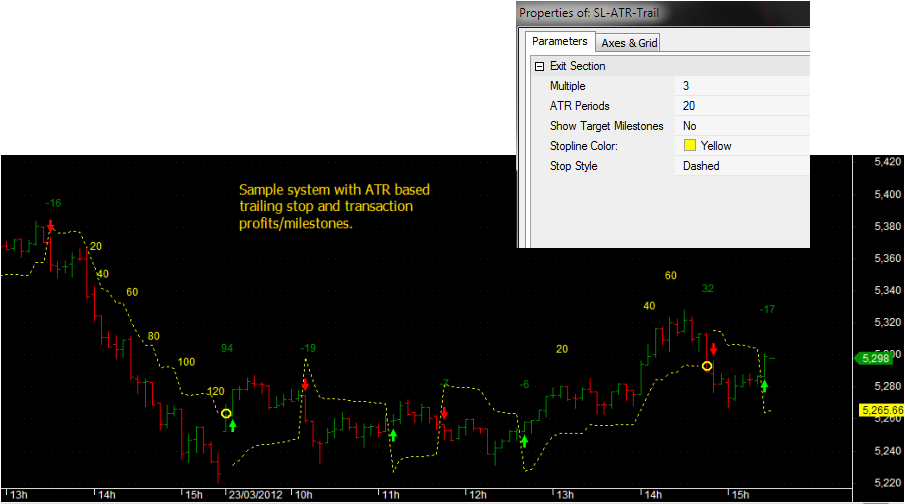
19.4 Should the stop loss level remain unchanged - Trailing SL?
This is a good point to consider. If we stick to the original stop loss level, we are not locking in potential profits as the trade moves in our favor. So one approach is to "trail" the price,once the trade is moving in our favor. However, its prudent to keep the trailing stop loss at a reasonable distance that it doesnt get whipsawed. See the diagram below.. Trailing SL in it can be varied by adjusting the ATR multiplier in the AFL.
| sl-atr-trail.afl |
19.5 Optimizing Stoplosses to maximize profit
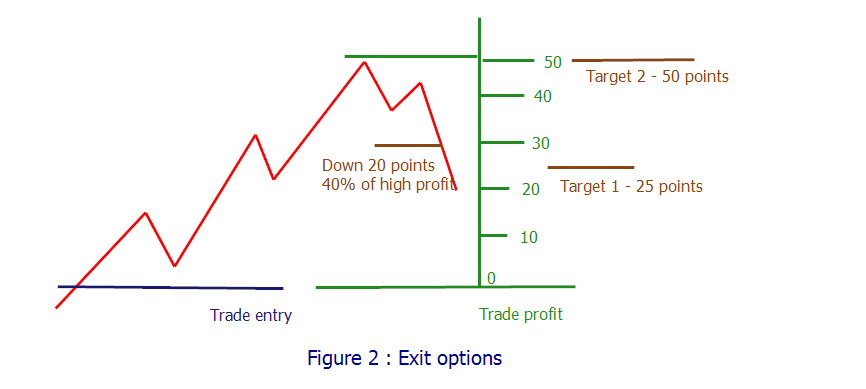
You cannot obviously catch the maximum profit. But you can certainly avoid losing too much profit, because the price dips. Introduce a placeholder that stores the current bar profit and exit the trade, if your highest profit target or profit drops more than n% of the highest profit event occurs. Cool isnt it. This is demonstrated in Figure 2 below.
You can exit the trade on achieving specific targets like 25 and 50 points or exit if the profit now is 40% of maximum profit. Or a combination of the two. In the combination approach, you would exit initial positions based on target and then trail the trade till an exit is forced by the maximum profit drawdown.
You can exit the trade on achieving specific targets like 25 and 50 points or exit if the profit now is 40% of maximum profit. Or a combination of the two. In the combination approach, you would exit initial positions based on target and then trail the trade till an exit is forced by the maximum profit drawdown.
Below here, breach of SL line forces an exit.
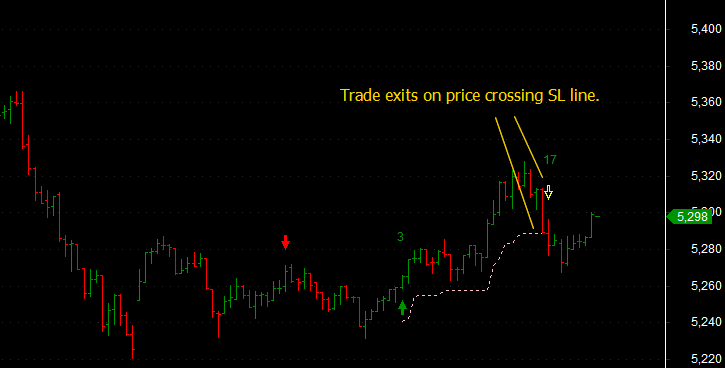
| sl-profit-exit.afl |
Here, profit threshold of drop more than 10 points from a minimum target of 30 points is used to trigger an exit. One can play around with these factors to build a good stable exit strategy suitable for the combinations of stocks that you trade in normally.
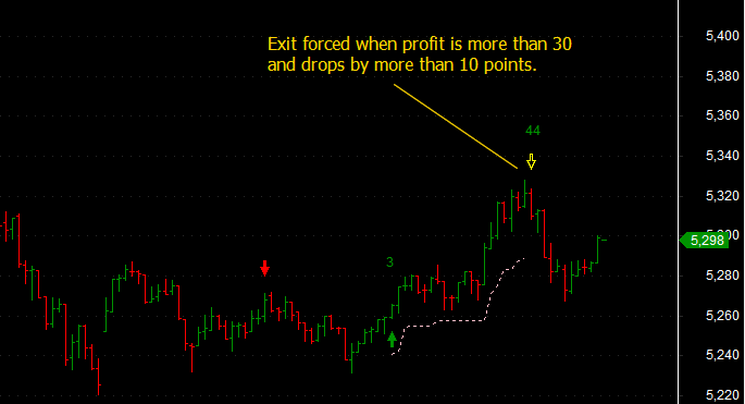
| sl-profit-exit-1.afl |
19.6 Relative Stop losses versus Absolute stop losses
So far we have been talking about free standing stop loss levels which have really no relationship with the price patterns. These were therefore, in a sense, absolute stoploss levels.
Once we start looking at price patterns, then the options for stop losses changes. For example, if you were using trendlines and using a 1-2-3 approach for entering a trade (1-2-3 approach is one where a primary move occurs, a retracement and then a move in the original direction) say at the low in an uptrend and at a high in a downtrend, the most obvious choice of stop loss, is then just below or above the lows and highs. This is demonstrated below for different trading methods in the figures/charts below. You can define your rules, but be careful in making sure these fit into your risk management approach.
Very important : While not specifically mentioned for any of the trading styles, be aware of recent supports and resistances for consideration for stop losses and targets.
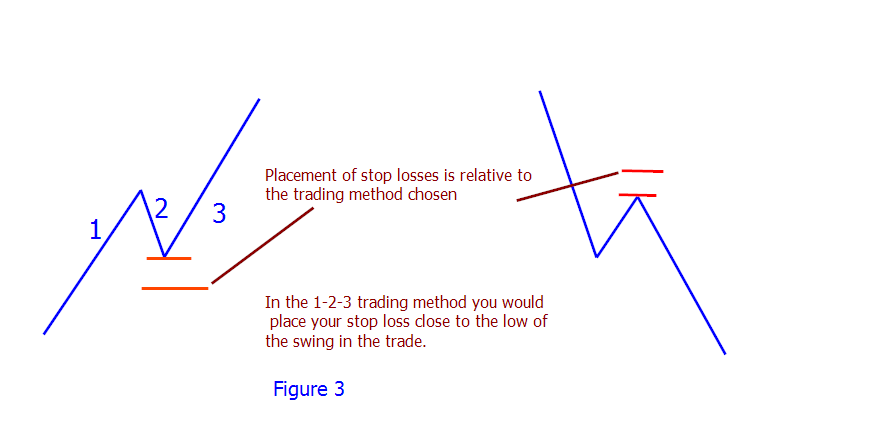
In the 1-2-3 trading style, you would place a stop loss just below the low of 2-3 segment in a long trade and just above the high in a short trade.
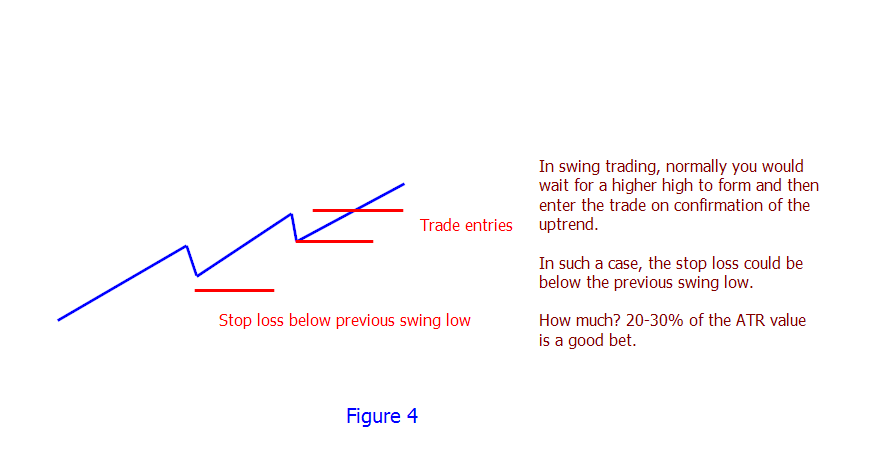
In the swing trading method, trend is confirmed by the formation of successive highs in an uptrend and successive lows in a downtrend. Stop losses can be placed just below the significant recent swing low or high in this case.
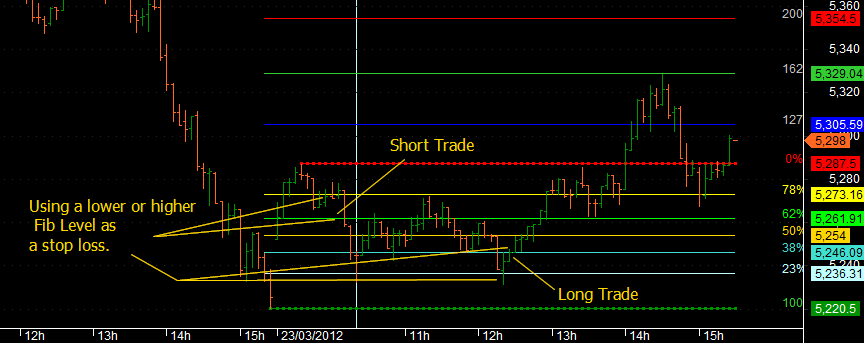
If you trade using Fibonacci levels, then using the Fib line below the low of your long entry is a good choice for a stop loss level.
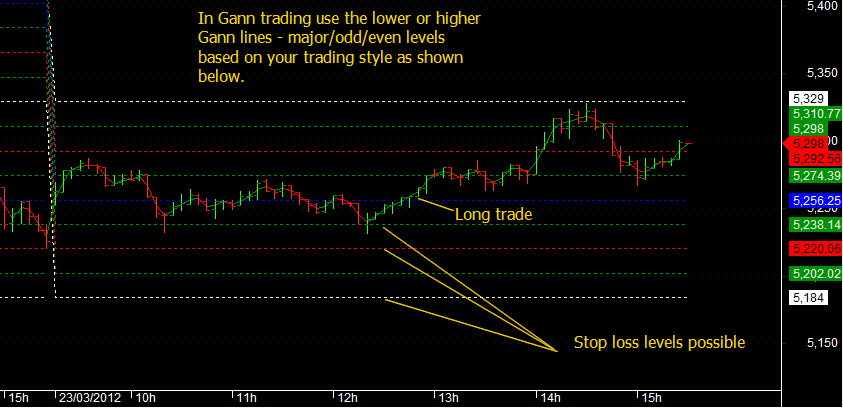
As a Gann trader, you have many options based on the time frame of trading. You can use either the finest levels settings and use the nearest lower Gann level in a long trade as the stop loss or alternatively, the corresponding significant level below/above your trade. If your long level starts above a green level line, you could use the next level, red line or even the next green line as stop losses. Tailor this to your risk management approach.
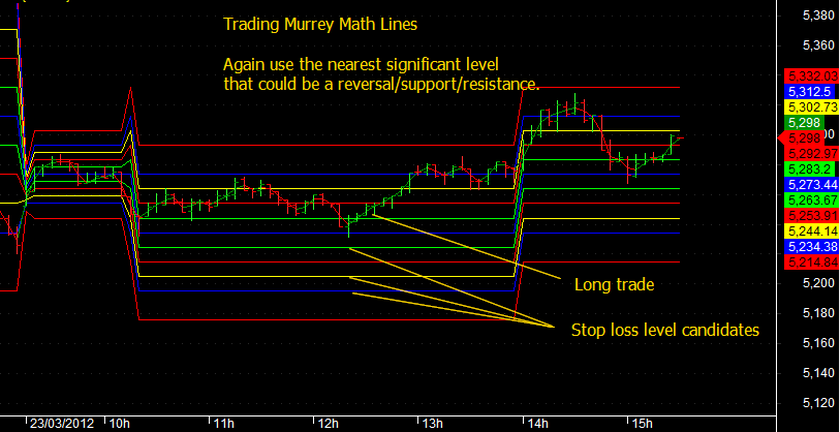
The same approach applies, when you use Murrey Math levels. Choose the significant reversal levels or nearest significant levels as the stop loss levels.
Remember that levels based trading always run the risk of price blowing through the levels, in volatile conditions.
The same approach applies, when you use Murrey Math levels. Choose the significant reversal levels or nearest significant levels as the stop loss levels.
Remember that levels based trading always run the risk of price blowing through the levels, in volatile conditions.
19.7 And finally, A complete System
Here is a structured script which you can use to replace the buy and sell logic with your own, and use the ATR based trailing stop method as a full sample which you may use that shows transaction profits and target milestones. Bells and whistles peak profit based exits etc, are not included at this stage, but can be easily added in the exit section.
| sl-atr-trail.afl |
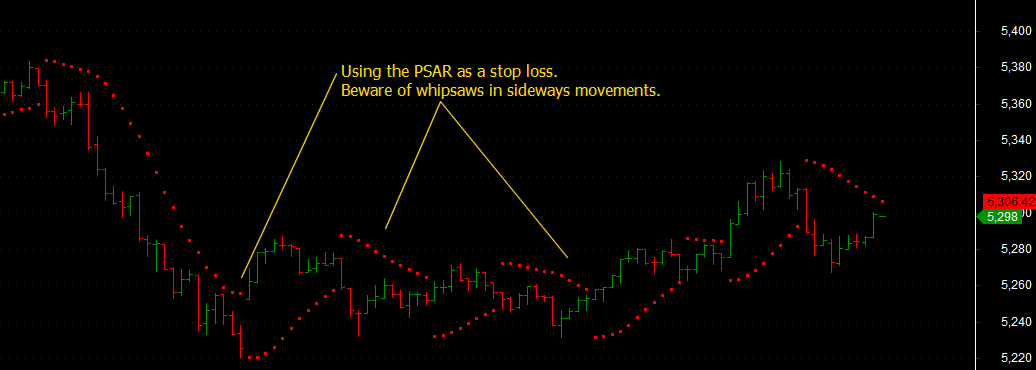
19.8 Parabolic Stop and Reverse based stop loss levels
How can we not include this in any discussion on stop losses!
The parabolic SAR is a technical indicator that is used by many traders to determine the direction of an asset's momentum and the point in time when this momentum has a higher-than-normal probability of switching directions. Sometimes known as the "stop and reversal system", the parabolic SAR was developed by the famous technician Welles Wilder, creator of the relative strength index, and it is shown as a series of dots placed either above or below an asset's price on a chart.
(Read more: http://www.investopedia.com/articles/technical/02/042202.asp#ixzz1q5xgqkmT)
The first entry point on the buy side occurs when the most recent high price of an issue has been broken; it is at this time that the SAR is placed at the most recent low price. As the price of the stock rises, the dots will rise as well, first slowly and then picking up speed and accelerating with the trend. This accelerating system allows the investor to watch the trend develop and establish itself. The SAR starts to move a little faster as the trend develops and the dots soon catch up to the price action of the issue. As you can see below, the indicator works extremely well when a stock is trending, but it can lead to many false signals when the price moves sideways or is trading in a choppy market.
The SAR line is used as a stop loss and a trade reversal signal. This indicator always keeps the trader within a trade.
Once the trend reverses, price goes against the dots of the SAR and the trade stops out and reverses. In trending markets, the SAR is an excellent tool to lock in profits in time.
No separate AFL is needed for the SAR formula as it is available in Amibroker itself as a standard formula.
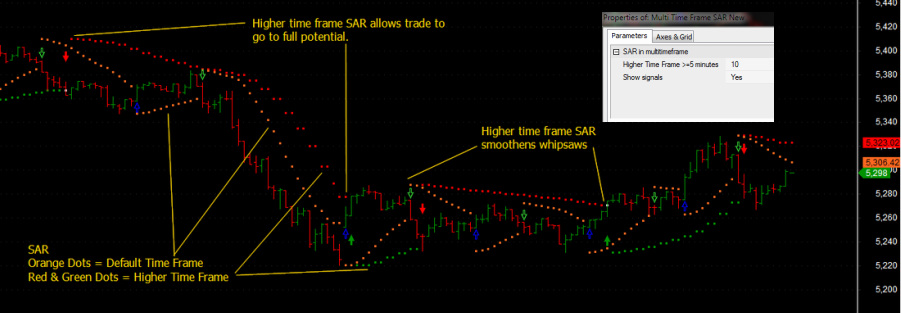
A variation of the SAR method is to use higher time frame SAR's to manage the whipsaw issue in lower time frames. Lets look at this as a useful approach to fine tune our stop losses. The chart below shows both low and high time frame SAR lines. The higher time frame SAR does simplify things !! The AFL for multiple time frame SAR is attached below. Have fun and profits!
You can incorporate the SAR stop loss approach in the simple trading system AFL shown earlier in this section to develop your own custom system.
One apparent problem with the SAR based entry is the high initial stop loss and the potential for the trade to reverse. The solution to this is to use trade entry from the SAR and combine that with an ATR based stop loss. If you get forced out of the trade but the SAR signal continues in the direction of the trend, re-enter the trade at a lower high in a short and higher low in a long trade. This approach simply reduces the risk of your trade, while allowing you to follow the persistence of the SAR method.
| multi_time_frame_sar_new.afl |
19.9 So much for Stop Losses - What about Targets?
When should we exit a trade? Thats another crucial question like stop losses. You exit too low and see the trade flying away to higher profits.
One approach is to use fixed targets based on risk reward approach. If you put a stop loss of 15 points, then use a target level of 1:1, 2:1 and so on i.e. targets of 20/30 points and so on.
A second approach can use the ATR for the time frame in question. For example if the ATR of an instrument is 10 points in the 5 minute charts, you can use multiples of this number as your target.
A more intelligent use of the ATR concept is to look at the trading time frame.
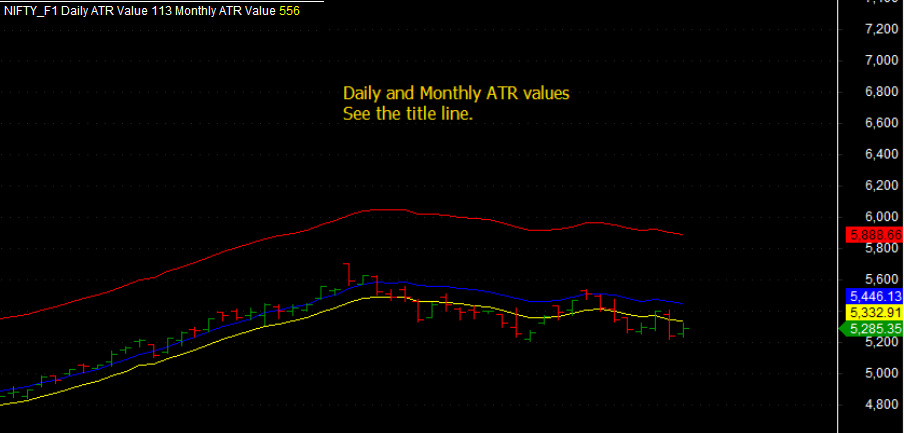
If you are an intraday trader, base your targets as a fraction of the daily ATR. For example, the Nifty index has a daily ATR of 100 points. You could fix targets as a fraction of that 25%, 50% or more based on your appetite. Likewise the monthly ATR number for Nifty is 556. As a day trader, you would normally expect a target not to exceed 60-70% of the daily ATR or 60-70 points.
If you are a short term trader, you could use the weekly ATR and for a long term trader you could use the Monthly ATR as a basis and have your target from 100-300 points for Nifty, as an example.
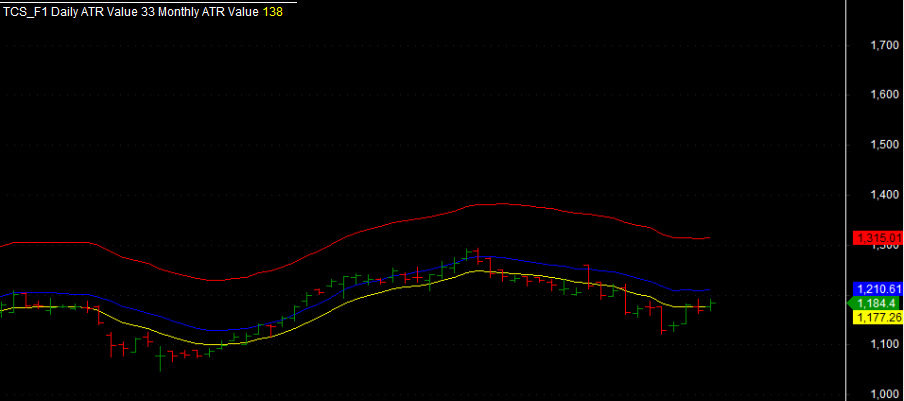
The chart below shows the daily/weekly and monthly ATR plots as an example for the Nifty Index Futures. Below that is that for TCS. For TCS the daily target range is 30 points and the monthly number is about 140 points. Choose your targets in that context!
For your convenience the simple AFL that shows you these ATR's is enclosed below.
One approach is to use fixed targets based on risk reward approach. If you put a stop loss of 15 points, then use a target level of 1:1, 2:1 and so on i.e. targets of 20/30 points and so on.
A second approach can use the ATR for the time frame in question. For example if the ATR of an instrument is 10 points in the 5 minute charts, you can use multiples of this number as your target.
A more intelligent use of the ATR concept is to look at the trading time frame.
If you are an intraday trader, base your targets as a fraction of the daily ATR. For example, the Nifty index has a daily ATR of 100 points. You could fix targets as a fraction of that 25%, 50% or more based on your appetite. Likewise the monthly ATR number for Nifty is 556. As a day trader, you would normally expect a target not to exceed 60-70% of the daily ATR or 60-70 points.
If you are a short term trader, you could use the weekly ATR and for a long term trader you could use the Monthly ATR as a basis and have your target from 100-300 points for Nifty, as an example.
The chart below shows the daily/weekly and monthly ATR plots as an example for the Nifty Index Futures. Below that is that for TCS. For TCS the daily target range is 30 points and the monthly number is about 140 points. Choose your targets in that context!
For your convenience the simple AFL that shows you these ATR's is enclosed below.
| atr_example.afl |
19.10 A complete system Trade Simulator with ATR based stops
The trade simulator in the Trading Systems VII section has been enhanced to add the ATR stop concept.
This is a really powerful simulation tool that traders who want to trade based on price patterns or on their own technical concepts can test before using them in real trades.. They can optimize their trading by varying the stop loss levels as per their choice. They can enter their real trade values and see the impact of their trading ideas in total.
Novice traders or those new to technical analysis, can just test their ideas of trading with trend lines, swing concepts or Gann Levels, Camarill or anything else using external inputs and plot the results of their actions in the simulator to see how profitable their trades could be.
Or if you just want to record a journal of your trades, this could be just it.
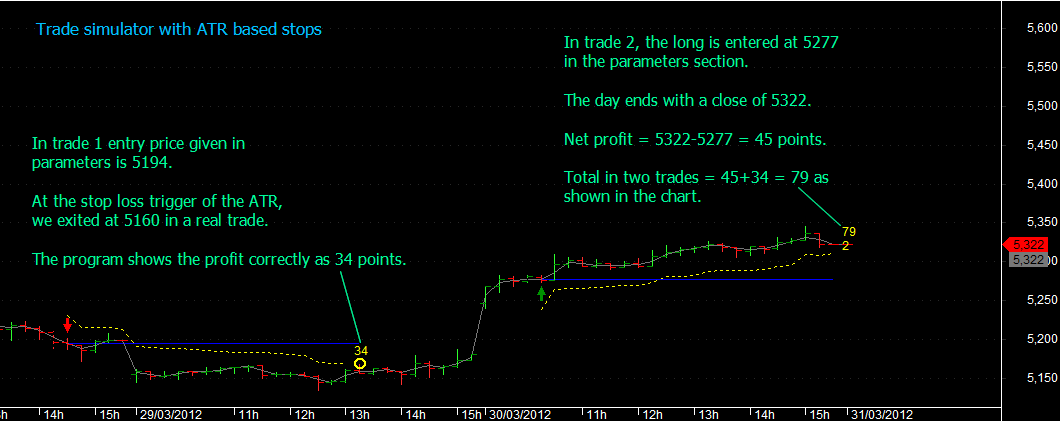
See the example given below.
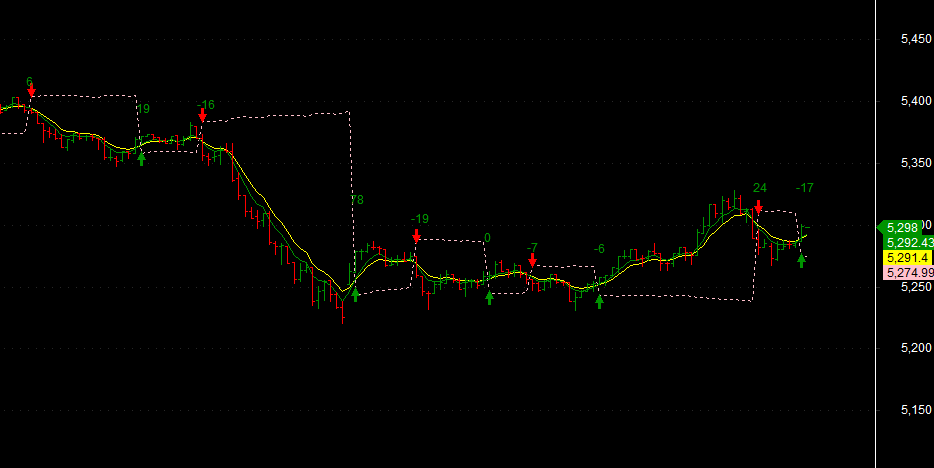
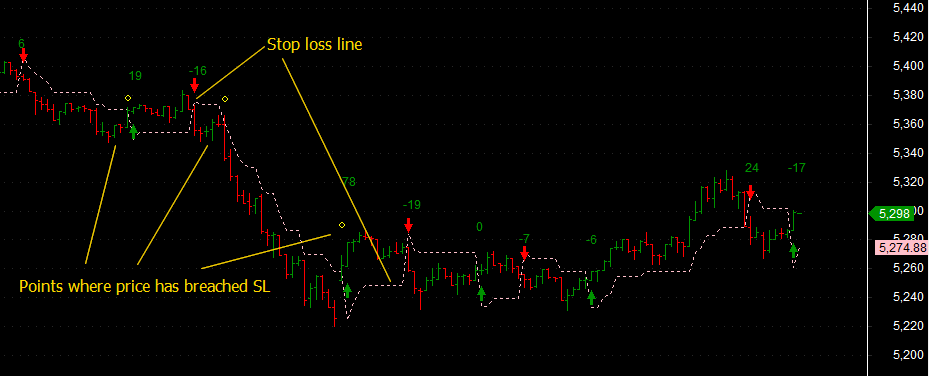
In trade 1 a short is done at a specific price that is entered in the parameters section. (By default, the system takes the price at the midpoint of the bar where the signal is generated). This is plotted on a 5 minute chart with trailing stop loss being 2.5 times the ATR, which is configurable in the Parameters section. You could also define the period of the ATR's (see the parameter box screenshot).
In the second trade, a buy signal is entered and it does not close at the end of the day, so the system displays the cumulative profit. If the trade is continued the next day, it will continue plotting the profit.
See Trading Systems VII section to configure and use the trade simulator.
Important : When the AFL used in a live environment with the new version with Buy/Sell signals added through parameter window, the signals were moving their positions when more bars were getting added. Thats been fixed.
This is a really powerful simulation tool that traders who want to trade based on price patterns or on their own technical concepts can test before using them in real trades.. They can optimize their trading by varying the stop loss levels as per their choice. They can enter their real trade values and see the impact of their trading ideas in total.
Novice traders or those new to technical analysis, can just test their ideas of trading with trend lines, swing concepts or Gann Levels, Camarill or anything else using external inputs and plot the results of their actions in the simulator to see how profitable their trades could be.
Or if you just want to record a journal of your trades, this could be just it.
See the example given below.
In trade 1 a short is done at a specific price that is entered in the parameters section. (By default, the system takes the price at the midpoint of the bar where the signal is generated). This is plotted on a 5 minute chart with trailing stop loss being 2.5 times the ATR, which is configurable in the Parameters section. You could also define the period of the ATR's (see the parameter box screenshot).
In the second trade, a buy signal is entered and it does not close at the end of the day, so the system displays the cumulative profit. If the trade is continued the next day, it will continue plotting the profit.
See Trading Systems VII section to configure and use the trade simulator.
Important : When the AFL used in a live environment with the new version with Buy/Sell signals added through parameter window, the signals were moving their positions when more bars were getting added. Thats been fixed.
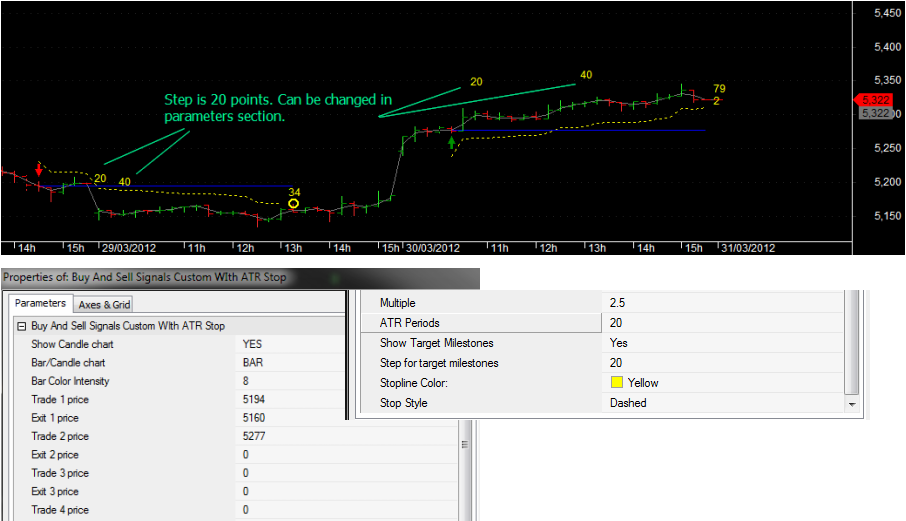
| buy_and_sell_signals_custom_with_atr_stop.afl |
19.11 Stop loss, risk management and trade entries
Why is this important? Often while I am trading, I see trading calls from my broker and sometimes wonder at their thinking. They may give a call like short at 5000 for a target of 4970 with stop loss 5050. For a reward of 30 points, the stop loss is indicated as 50 points?!! Which gives a reward to risk ratio of 0.6! I would never take a trade like this, as I would like to see that ratio to be at least 1 or more. In rare cases, where you may take a lower ratio, is where you have an indication that this trade is part of a larger movement, where pyramiding would give a better return.
So first point that you need to consider is to always maintain your reward to risk ratio more than or at least 1 unless you are sure there is a bigger move that will ultimately give this ratio.
A second aspect that you may consider is that is it worthwhile to enter all your positions at the first entry signal? Or should you pyramid your entries in a progressive way. If you want to reduce risk, the pyramiding approach makes sense.
Pyramiding or progressive entry itself can be done in two different ways - first on a fixed point interval or at specific new entry signal basis. In the first approach, you would enter additional lots at every 10 points (say) - a number which can be 15-20% of the daily ATR or average traded range for the instrument. So for Nifty futures, where the ATR is about 100, we could enter additional lots at steps of 15 points. In the second case, you enter additional lots on new buy signals withing a trend. The second approach, may or may not always result in additional trades based on the price action.
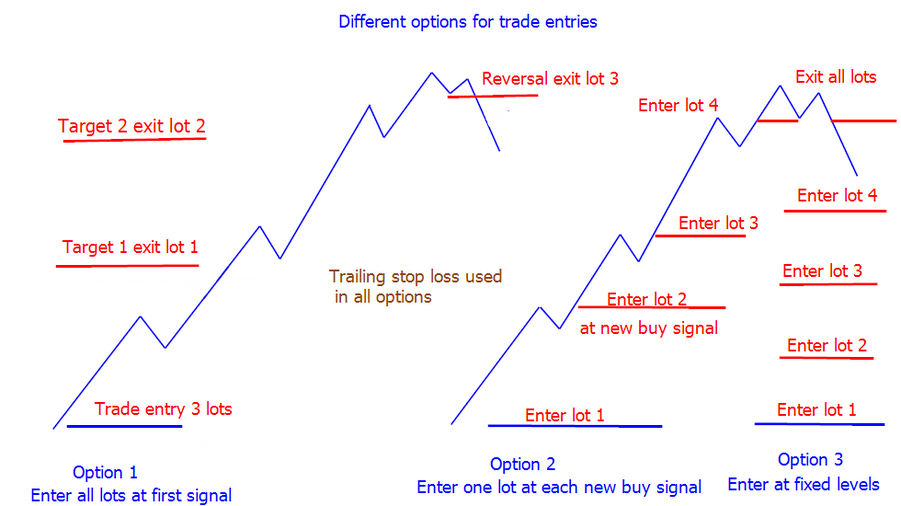
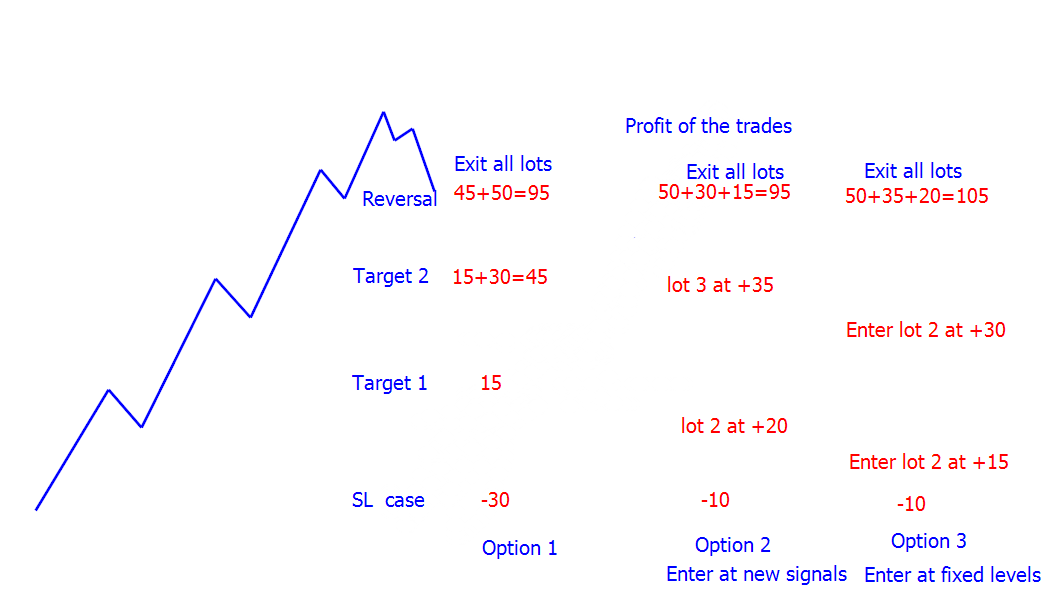
In either case, you exit all lots on achieving a fixed target level from the first trade or on the first reversal signal. The stop loss used in all cases is a trailing stop loss appropriate for the trading method that you use. The three trading options are shown below. Each of the options 2 and 3 reduce the overall trading risk as compared to option 1.
In option, until the first target is achieved, all lots traded run the exposure of stop loss. In options 2 and 3, till the next trade entry, the risk is of only 1 lot or 1/3rd of that in option 1. Now you may ask what about the performance? See that in the next chart.
As you can see the profits are quite similar as each approach uses a progressive exit or entry. However, the risk is the lowest in the latter two options. You may argue that lot 3 entered last may have higher risk in the latter two options. Best is to try it out for yourself and see what works best!
So first point that you need to consider is to always maintain your reward to risk ratio more than or at least 1 unless you are sure there is a bigger move that will ultimately give this ratio.
A second aspect that you may consider is that is it worthwhile to enter all your positions at the first entry signal? Or should you pyramid your entries in a progressive way. If you want to reduce risk, the pyramiding approach makes sense.
Pyramiding or progressive entry itself can be done in two different ways - first on a fixed point interval or at specific new entry signal basis. In the first approach, you would enter additional lots at every 10 points (say) - a number which can be 15-20% of the daily ATR or average traded range for the instrument. So for Nifty futures, where the ATR is about 100, we could enter additional lots at steps of 15 points. In the second case, you enter additional lots on new buy signals withing a trend. The second approach, may or may not always result in additional trades based on the price action.
In either case, you exit all lots on achieving a fixed target level from the first trade or on the first reversal signal. The stop loss used in all cases is a trailing stop loss appropriate for the trading method that you use. The three trading options are shown below. Each of the options 2 and 3 reduce the overall trading risk as compared to option 1.
In option, until the first target is achieved, all lots traded run the exposure of stop loss. In options 2 and 3, till the next trade entry, the risk is of only 1 lot or 1/3rd of that in option 1. Now you may ask what about the performance? See that in the next chart.
As you can see the profits are quite similar as each approach uses a progressive exit or entry. However, the risk is the lowest in the latter two options. You may argue that lot 3 entered last may have higher risk in the latter two options. Best is to try it out for yourself and see what works best!