8. Chart Analysis - Introduction
Now that you are familiar with the basics of charts, understand support, resistances and trends and what chart patterns mean, the next step is to understand how you can analyse charts.
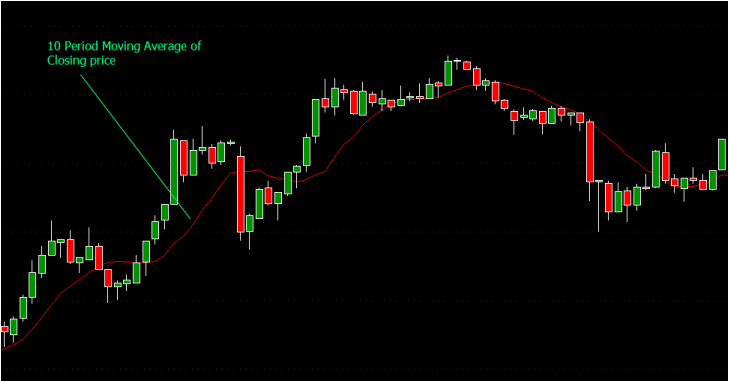
The simplest method of analysing charts is to plot the simple moving averages of the underlying price on the charts. You could draw line charts or use the closing price on a candle or bar chart. Lets see how they look like in a 5 minute time frame. (the time frame is immaterial at this time)
The simplest method of analysing charts is to plot the simple moving averages of the underlying price on the charts. You could draw line charts or use the closing price on a candle or bar chart. Lets see how they look like in a 5 minute time frame. (the time frame is immaterial at this time)
8.1 Exponential Moving Average
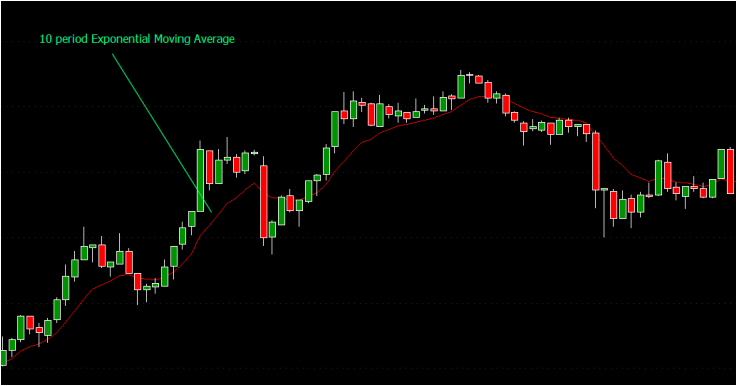
And then the exponential moving average. The EMA as its more commonly called, is weighted closer to the current price of the scrip. That makes it follow the candle pattern more closely as compared to the simple moving average or SMA.
8.2 SMA and EMA compared
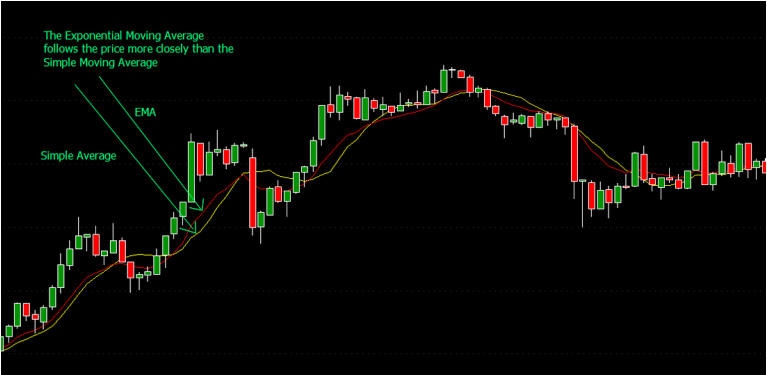
And now lets compare them together. You will notice that the EMA follows the price line more closely than the SMA. And thats because the SMA is "delayed" because of the equal weightage to all prices in a given period. The effect of the delay is significant, when you use these lines for developing charts for trading. Generally, the EMA is preferred in such situations.
8.3 Short and long period moving averages characteristics
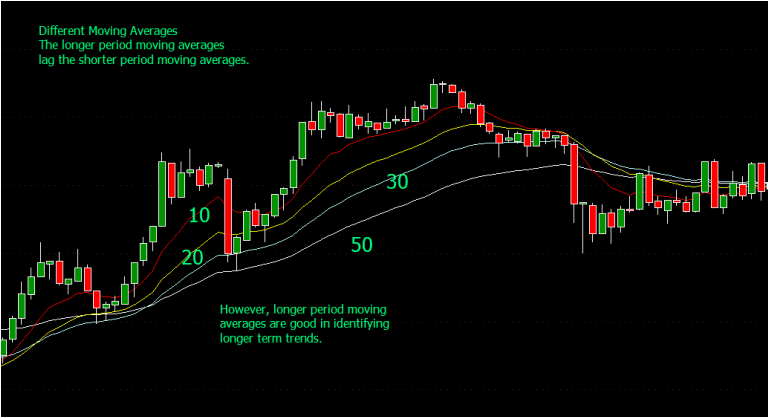
Now we draw 10, 20, 30 and 50 period EMA charts. Observe how the longer period average line smoothens out and seems to lag the shorter period lines. This is an important characteristic, which is also used to develop a simple trading system.
8.4 A simple moving average based trading system
Using the characteristic that a short period or "faster" moving average will "cross over" a longer period or "slower" moving average, we can develop a simple moving average crossover based trading system. These charts are used more effectively when you move to Swing trading (click the link). For now see below:
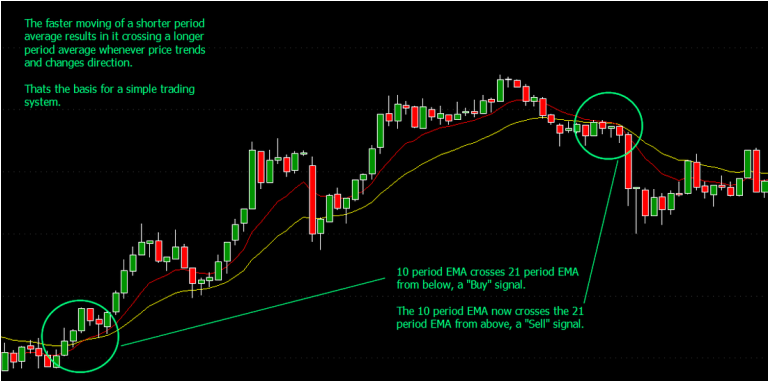
8.4.1. Basic code
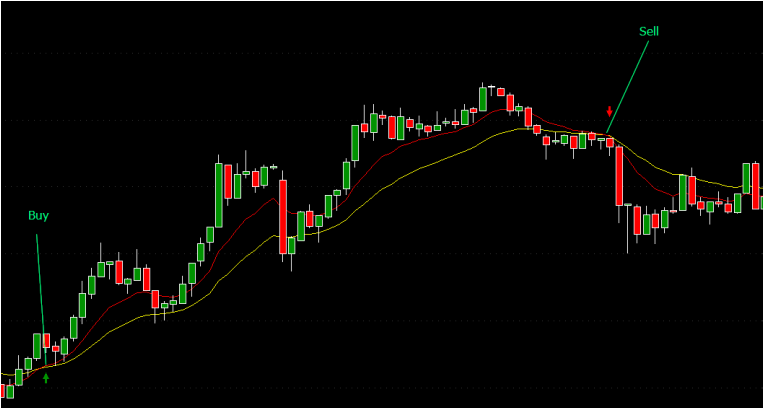
Here is the Amibroker AFL code that generates the simple buy and sell signals :
Plot(C,"Close",colorWhite,styleCandle);
Plot(EMA(C,10),"MA-10 Period",colorRed,styleLine);
Plot(EMA(C,21),"MA-10 Period",colorYellow,styleLine);
Buy=Cross(EMA(C,10),EMA(C,21));
Sell=Cross(EMA(C,21),EMA(C,10));
shape1 = Buy * shapeUpArrow + Sell * shapeDownArrow;
PlotShapes(shape1,IIf(Buy,colorGreen,colorRed), 0, IIf( Buy, Low-5, High+5));
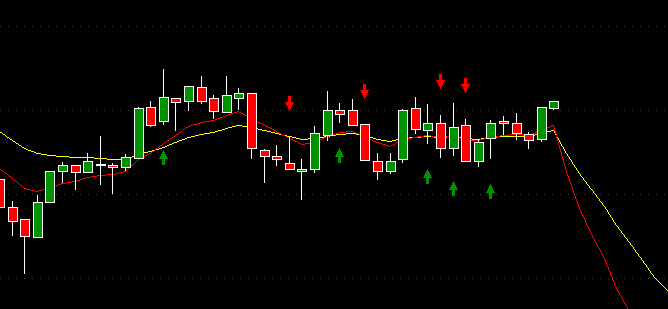
8.4.2 Noise
Moving average based trading systems will work well when markets are trending, but no sooner sideways or volatile movement occurs, the signals become unreliable. See below. That shows the limitation of average based system. This is just an initiation into trading systems. We will look at greater detail in a separate section for different approaches to trading systems.
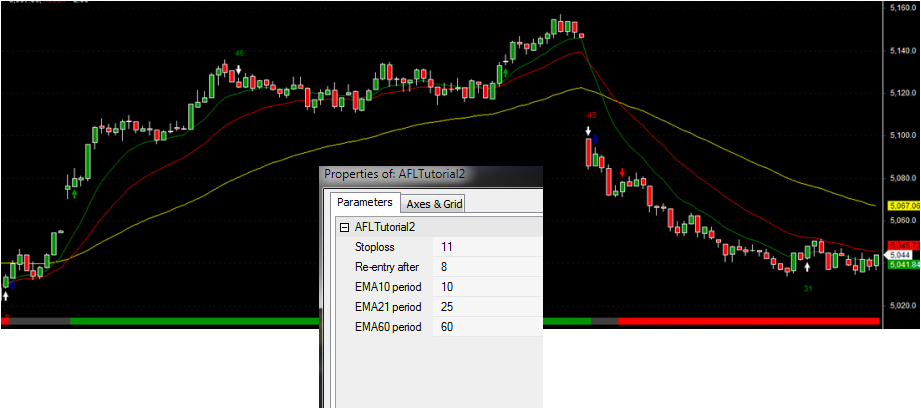
8.5 Basic Trading System based on Moving Averages
Attached below is an Amibroker AFL that gives a basic trading system with 10,21 and 60 day moving averages to help you observe trends. Trade only when there is a significant slope and avoid trading when the moving average are near horizontal or horizontal. This system will work well in all time frames. As a general rule, buy above the 10/21 EMA lines and sell below the 10/21 EMA line crossovers. The green and red arrows represent buy and short signals while white is a profit protector exit and blue is the final exit. It provides for re-entries within a trend. The stop loss and re-entry levels are adjustable and so are the EMA periods. Re-entry refers to how many points away from the last exit, a new trading signal should be generated. See the picture below. So long as you dont trade in ranging periods, you can trade easily with this system.
| afltutorial2.afl |
8.6 Moving average crossover choices
See section 10.2a in Trading Systems I - Moving Averages and Range Breakouts.
8.7 Other approaches to Trading systems
While moving averages are based on average lines that depend on price action, there are other approaches, which we will discuss in the coming sections, which are summarized below.
There are deterministic approaches which try to catch market trends. I would classify these as
1) Those which use price action to determine the trend. In this area, systems such as Moving Averages, Stochastics, RSI and various oscillators and indicators come in.
2) Level based trading. Here entry and exit is determined by logical levels. The fundamental thinking behind this is that the market always gravitates to a mean or average level in various time frames..Minute, hour, day and so on. The most classic of these approaches are:
Open Range breakouts and the Camarilla systems.
3) Those mystical numbers!
Yes, this is about astorology and hocus focus. That the markets move in patterns controlled with natural rythm or even planetary movements. Thats where Gann and its subset Murray maths come in. You derive levels based on octave patterns and use them for trading. Since so many people believe in them now, they have become self fulfilling for high volume indices and stocks/other instruments.
4) Wave theories, Fibonacci retracements, Pivots and other deterministic approaches.
All of these are similar in concept to the market tending to a mean level.
5) Statistical methods - the Bollinger Band
This one is interesting, and the question which comes to mind. Whether the chicken came first or the egg. So price action determines the direction of the band or the otherway round . But by saying, that price will always be within 2 standard deviations of the mean, creates a whole new approach which people have tried to master.