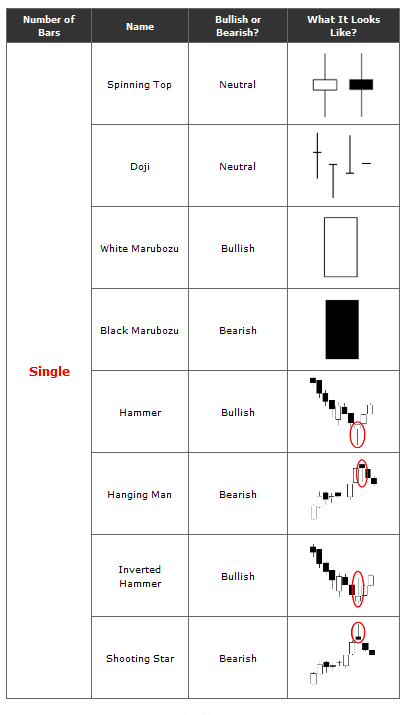
6. CandleStick Patterns
Japanese candle stick charts are amongst the most frequently used chart types by analysts. The shapes, sizes and sequence of these candlesticks indicates important price action before the event. A word of caution, candlestick patterns have limited use in intraday trading, because of the short duration that the effect of the pattern lasts, which is usually, a few candles. On a 5 minute chart, that would mean a duration of 5-10 minutes. For this reason, candlestick patterns are best utilized for medium and longer term trading periods.
An Amibroker AFL that recognizes most common patterns given here is also attached at the end of this section.
The beginners reference for this subject is Babypips - http://www.babypips.com/school/what-is-a-japanese-candlestick.html
An Amibroker AFL that recognizes most common patterns given here is also attached at the end of this section.
The beginners reference for this subject is Babypips - http://www.babypips.com/school/what-is-a-japanese-candlestick.html
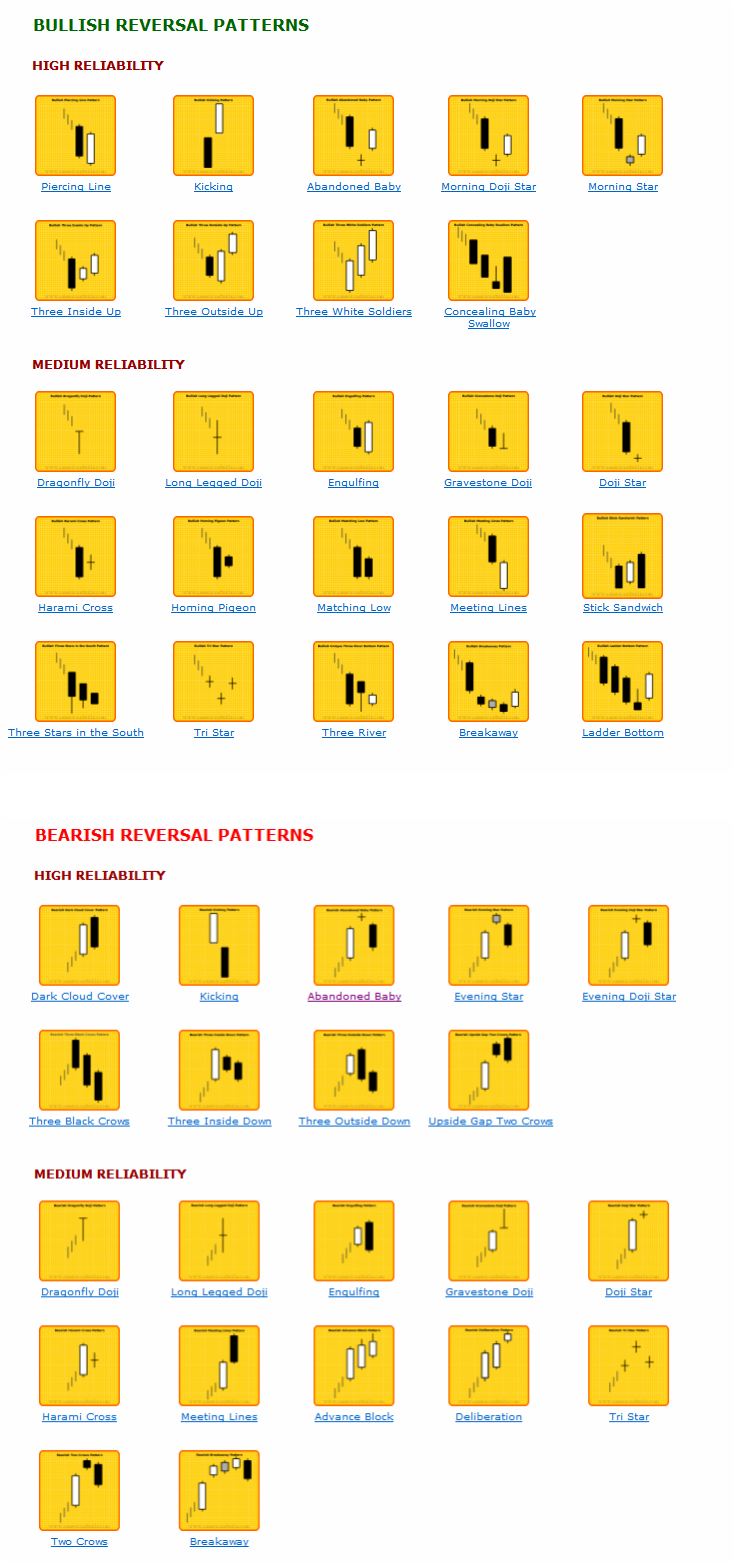
6.1 Multiple Candlestick Patterns
Once youve learnt the basics, get to the next subject of multiple candlestick patterns. The main ones that are of interest are the high and medium reliability bullish reversal and bearish reversal patterns shown in the charts from candlesticker.
The interpretation of candlestick charts is based primarily on patterns. The most popular patterns are thoroughly explained in this website. The patterns are examined in three main groups as “Bullish”, “Bearish”, and “Neutral”. These groups are further subdivided with respect to the type of the patterns as “Reversal”, “Continuation”, and with respect to their reliability as “High Reliability”, “Medium Reliability” and “Low Reliability”.
Candlestick charts are flexible, because candlestick charts can be used alone or in combination with other technical analysis techniques. A significant advantage attributed to candlestick charting techniques is that these techniques can be used in addition to, not instead of, other technical tools. In fact this system is superior to other technical tools. Candlestick charting techniques provide an extra dimension of analysis. As with all charting methods, candlestick chart patterns are subject to interpretation by the user. As you gain experience in candlestick techniques, you will discover which candlestick combinations work best in your market.
Click here for Bullish patterns
Click here for Bearish patterns
6.2 Original Amibroker AFL for Candle Pattern Recognition
Attached here is an AFL that will detect the more reliable patterns in a chart in any time frame.
| candle_patterns.afl |