13 Those Mystical Lines v 2.0 - Murrey Math Lines
Murrey math lines (MML) is a relatively new trading indicator showing supports and resistances, and helps in finding trends and trend changes. The indicator was developed by T. Henning Murrey and has some similarity to Fibonacci retracement and pivot points. MML was created based on the observations of Gann studies and is a simple way to implement Gann.
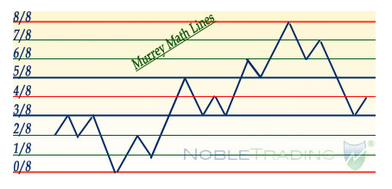
Murrey math lines comprise 9 equidistant lines which run parallel to one another. MM lines from the bottom are at the levels 0/8, 1/8, 2/8, 3/8, 4/8, 5/8, 6/8, 7/8 and 8/8. 0/8 is the oversold line and 8/8 the overbought line; these are the hardest lines to cross and around 75% of the time, the crossing triggers price reversal. The range between 3/8 and 5/8 is the normal trading range and price tends to consolidate at these levels before falling (3/8 line) or rising (5/8) beyond this trading range.
Like Fibonacci retracements, when the price is between two lines, the upper line is considered as resistance and lower line is considered as support. When the price rises above 5/8 and touches 6/8, it has a tendency to reverse to retest the 5/8 level before heading high. The same is also applicable to downtrends; the price tends to reverse to retest the 3/8 level before heading down.
Credit for this definition : NobleTrading
Caution: Murrey Math lines are a set of support and resistance lines and like any such line are NOT predictive. Which means that when you trade with these lines, there is a risk inherent in the trade, which is mitigated by the "likelihood" of price moving in the direction suggested by Murrey. Hence, any trading strategy based on Murrey Math lines or MML must have a strong risk management or stop loss overlay to avoid losing capital
13.1 Murrey Math Lines - Understanding the Levels
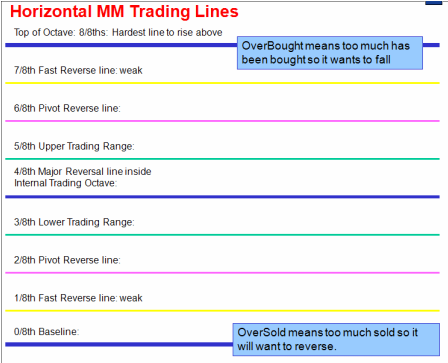
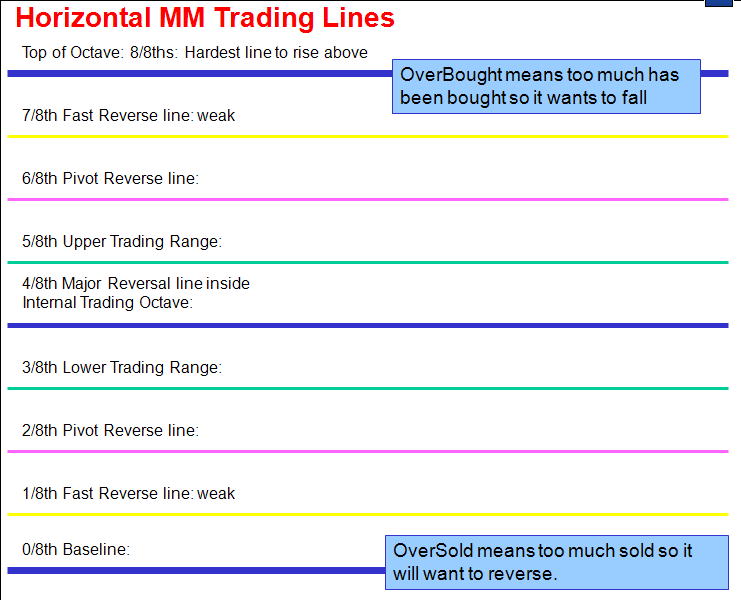
This graphic illustrates the following:
8/8: Hardest line to rise above (overbought)
7/8: Fast reverse line (weak)
6/8: Pivot reverse line
5/8: Upper trading range
----------------------------------------
4/8: Major reversal line
----------------------------------------
3/8: Lower trading range
2/8: Pivot reverse line
1/8: Fast reverse line (weak)
0/8: Hardest line to fall below (oversold)
Read more at BigMikesTrading Blog
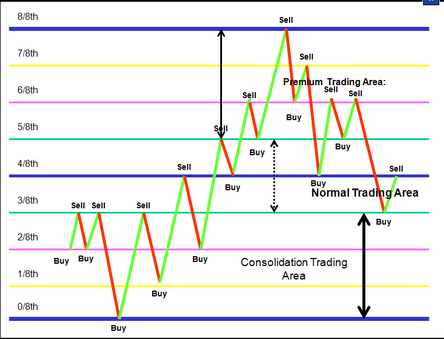
What this is showing us is that many times, if price is above the 5/8 line and falling, it will generally stop and consolidate around 5/8 first before heading lower. The same is true in the opposite direction: if price is below the 3/8 line and rising, it will generally stop and consolidate around the 3/8 line before heading higher.
On top of that, if price is between the 5/8 line and 6/8 line and heading higher, the tendency is to bounce off/reverse off the 6/8 line and retest 5/8 before heading higher. The same is true for shorts, if price is between the 3/8 line and 2/8 line and heading lower, it tends to bounce off the 2/8 line and retest 3/8 before heading lower.
Why does price do this? Remember, price is between the 3/8 and 5/8 line about 43% of the time. So before it jumps outside of its comfort zone, it needs to be sure (hence the retest).
Now let's take a quick look at what happens when price moves above 8/8 or below 0/8. This does not occur too often, but when it does it's important to know what to expect.
The above illustration tells us the following: If price moves above 8/8, 75% of the time the price will reverse off the +1/8 line and retest 8/8 before moving higher to +2/8. Similarly, if price falls below 0/8, 75% of the time the price will reverse off the -1/8 line and retest 0/8 before moving lower to -2/8.
Now, if price moves beyond the +1/8 or -1/8 lines, then 95% of the time it will reverse when it hits +2/8 or -2/8. Remember, the market was already in overbought (8/8) or oversold (0/8) mode, so once we push that to the extreme (+2/8 or -2/8) it is extremely unlikely (95% chance) to reverse.
Check out this illustration to see it demonstrated:
Read more at BigMikesTrading Blog
Read more : BigMikesTrading Forum - MM Lines (you may have to join it)
and at Forexfactory Karthiks thread
Some informational Murrey Math postings from various forums including an apparently original MM learning presentation (25MB).
and at Forexfactory Karthiks thread
Some informational Murrey Math postings from various forums including an apparently original MM learning presentation (25MB).
| murreystuff.zip |
| murrey_math_presentation.pdf |
13.2 Murrey Math Lines AFL
The Murrey Math AFL is described here, as this is a major improvement on the AFL commonly found on the web. The AFL provided here is goes far beyond the original Octave logic. The primary features of the AFL are as follows:
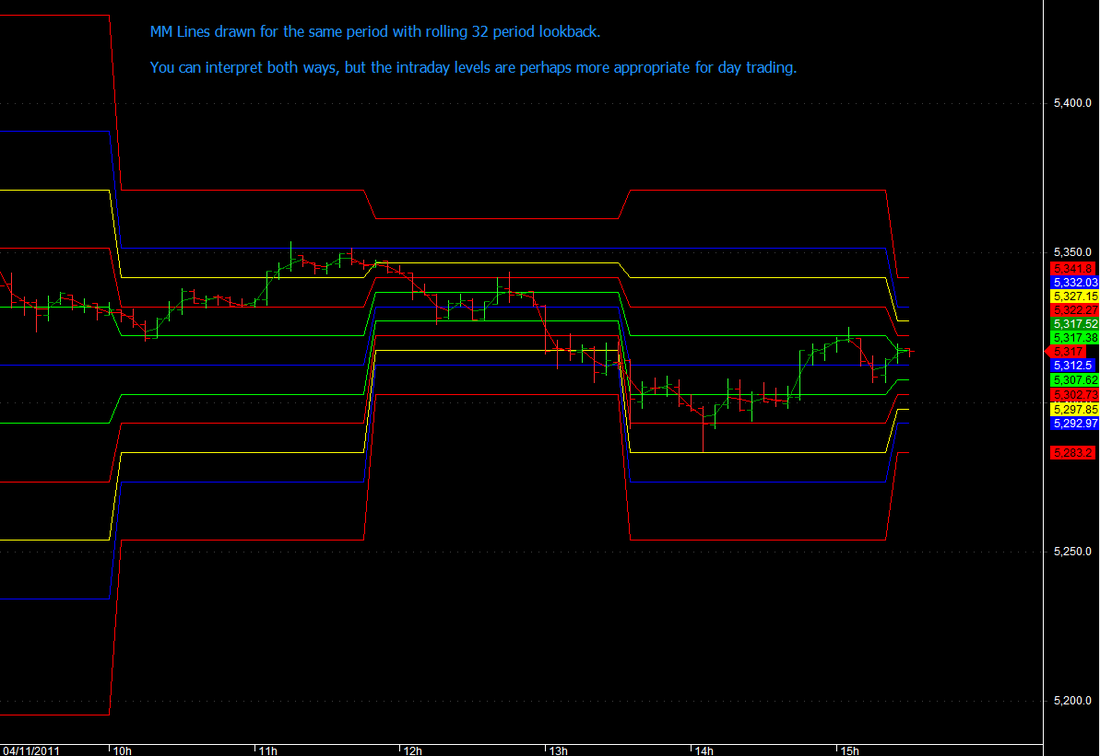
Normal positional trading settings : You can use 32 or 64 period rolling look back for the highs and lows for the MML to be plotted. Best suited for positional trading.
Intraday settings : Choose these, when you trade intraday. The system then draws MML using the highs and lows of the day only. Best for all intraday timeframes.
Pattern Recognition: This has been added, so that you can trade with more certainty. As you know MML's are just support and resistances, we need some confirmation on the possible direction of the next move.
An important feature of this AFL is that it shows the historical movement of the MML levels, which to my knowledge no other software available elsewhere provides. This gives extra information for movement of the support and resistance levels which can be used in your trading strategy.
Also included is pattern recognition, which helps higher probability trade entry setups.
The most powerful feature of this AFL is the predictive level. What if price moves above the +2/8 level (that is the boundary of the current time frame) or falls below -2/8 level which are two octaves above and below the standard levels (0 and 8). The +2/8 and -2/8 levels are marked in the chart below. Some analysts also refer to them as 10/8 or -2/8 levels. And logically, its possible to draw 9/8 and -1/8 levels too.
13-11-2011 Modififed Murrray Math AFL to show important supports and resistances in the title so that they can be used as targets along with day highs and lows.
| murray_maths_with_patterns_modified_intraday.afl |

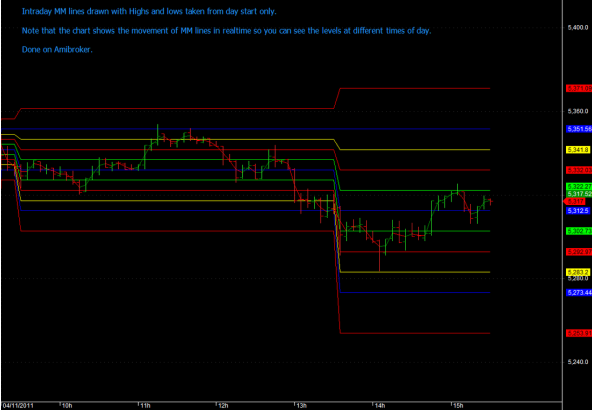
See the two graphics. The first one on the left is for intraday periods. And the next one below is done on a 32 period rolling basis. Choose the appropriate parameters in the parameter boxes.
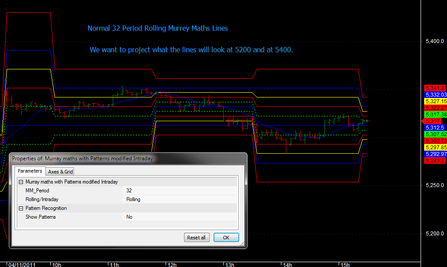
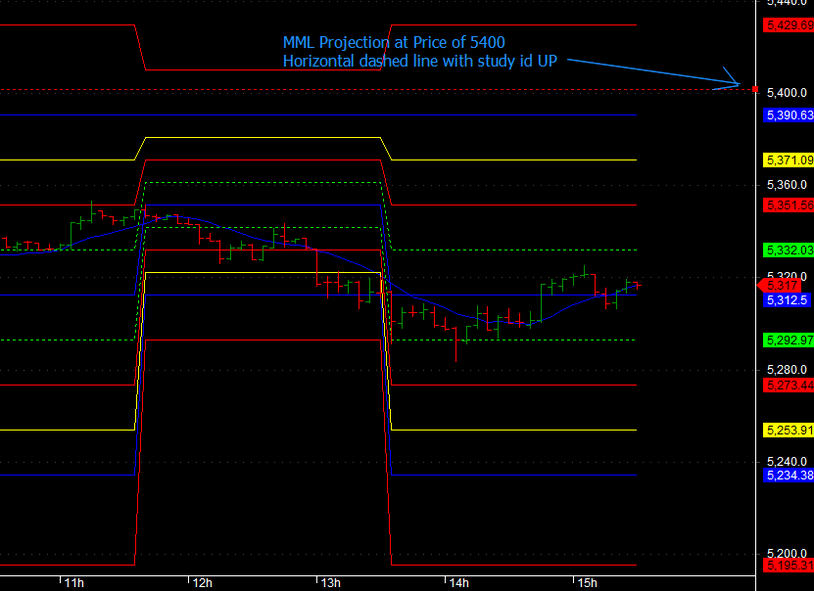
What if you wanted to project what would happen to the levels if price moved to 5400 or to 5225?
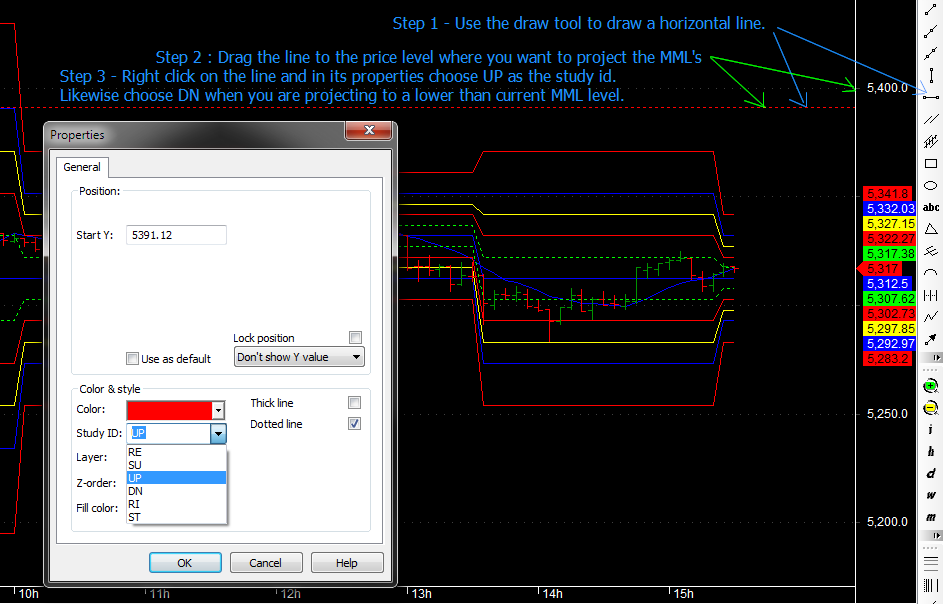
Simple, draw a horizontal line with the Amibroker draw tool and rename it to UP in its properties box and drag it to the price level above the current time frame. This is shown below. And voila! you have the MM lines change their context immediately.
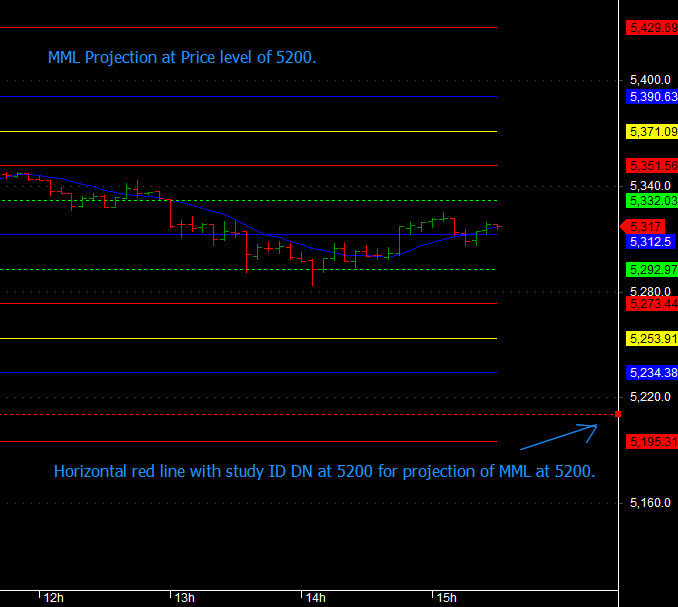
Do the same for the lower price targets.
With this you can project the potential new support and resistance levels and hence the potential targets for your trades. More on that later.
What if you wanted to project what would happen to the levels if price moved to 5400 or to 5225?
Simple, draw a horizontal line with the Amibroker draw tool and rename it to UP in its properties box and drag it to the price level above the current time frame. This is shown below. And voila! you have the MM lines change their context immediately.
Do the same for the lower price targets.
With this you can project the potential new support and resistance levels and hence the potential targets for your trades. More on that later.
13.3 Price Projection on the AFL. What if?
You want to project what will happen if the price moves to 5400 and to 5200.
Draw the red dashed line as shown in the second chart and drag it to the price level 5400. Then right click and in the study ID drop down choose UP. Thats it!
Likewise when you want to project the MML at 5200 draw another line or drag the current line below to 5200 level and choose the study ID DN in the drop down.
This gives you an excellent way to set targets and look at new support and resistance levels.
13.3 Trading with Murrey Math Lines - Safe trading
Since MML's are only support and resistances, you need to use them with high probability setups.
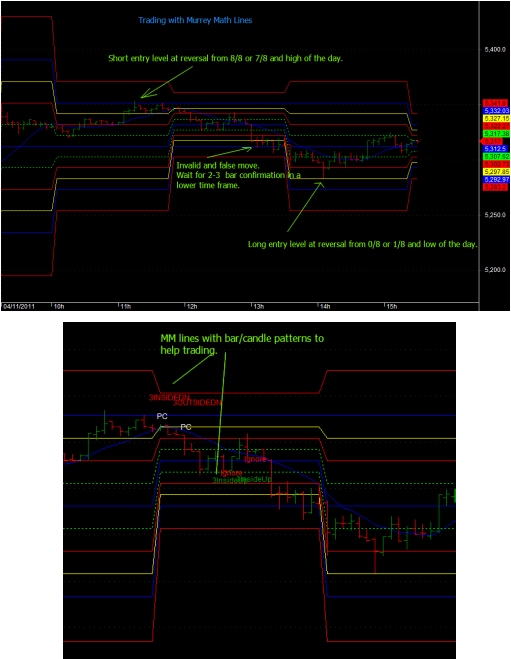
Here is an approach for safe trading. Wait for a significant high or low for the day (unless its a high or low at open of the day) and wait for a move away from 8/8 or 0/8.
If the high of the day is apparently on open and the price starts to fall below 7/8 from 8/8 level, short the scrip ensuring your stop loss is in place. Look for a 1:2 or 1:3 return on your stop loss entry. Likewise for low of the day you would enter a long on cross of 7/8 and confirmation bars in a lower time frame.
If the price stays at 4/8 level, wait for price action to move to 7/8,8/8 and with a reversal short with stop loss or if it moves to 0/8,1/8, wait for reversal (and its a high or low of the day), enter your trade with ensuring a stop loss is in place.
Intraday trades: use the 5 minute charts with Intraday parameter settings and use 1 or 2 minute charts for checking confirmation bars for the direction of your trade before entering.(or any other method for trend confirmation such as MA crossovers).
Positional trades: use an hourly or 2 hourly chart and use 30/15 minute charts for trend confirmations. For trading on daily charts, use the hourly charts for confirmations.
Once a trend forms, exit on targets using the level project method and trailing stop losses.
Use the patterns recognition feature when trading positional to improve success of trades.
Caution: Always ensure stop losses are in place, as MML are only supports and resistance and do not have predictive capability!
Should you have any suggestions or contributions, please write to me at [email protected] or post you comments in the forum
or at http://www.inditraders.com/technical-analysis/5434-learn-technical-analysis.html
13.4 More submissions
See below. Documents on usage of the MM levels and alternative excel level calculator.
| gann_-_enthios_calculator.xls |
| murrey.doc |
| mm.doc |