Trading Systems X - Trading without indicators
Price is the most powerful indication of stock movement. Why cannot we use it directly for trading?
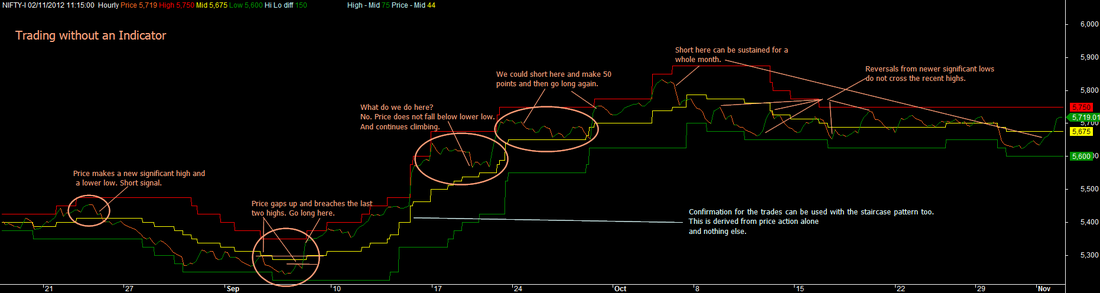
Sure, we can, and here is a demonstration of how it is done. See the chart below. This shows the price line and highs and lows based on a proprietary step pattern. See how trades are generated, whenever price reverses from a new significant high or low and makes a lower high or a higher high respectively. Clear and unambiguous signals! This is done in Hourly charts. See below, intraday price action on the same principle.
Sure, we can, and here is a demonstration of how it is done. See the chart below. This shows the price line and highs and lows based on a proprietary step pattern. See how trades are generated, whenever price reverses from a new significant high or low and makes a lower high or a higher high respectively. Clear and unambiguous signals! This is done in Hourly charts. See below, intraday price action on the same principle.

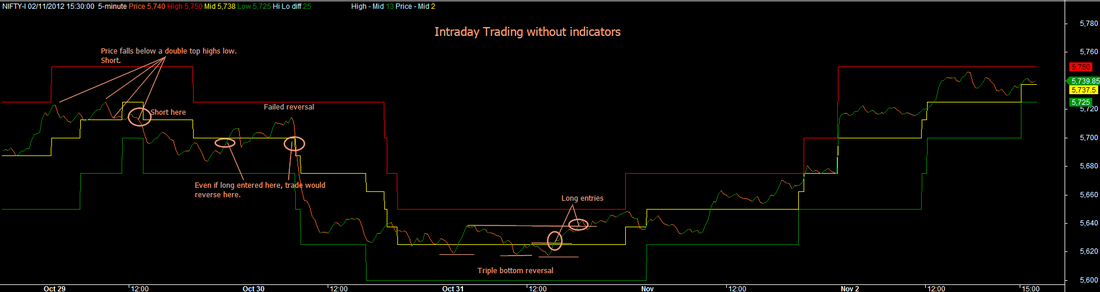
See the same action in intraday time frame of 5 minutes. One of the interesting natural supports and resistances that this approach uses is respecting the levels of 00/50/100 etc. This is varied based on the stocks intrinsic value (100's, 500's etc.).

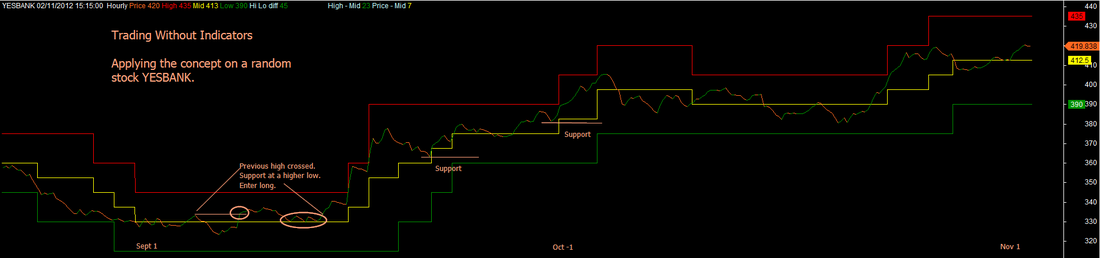
Testing the concept on a random stock - YESBANK. On hourly charts. Shows how an upmove of Rs 100 could be captured.
If you want to trade without indicators, get in touch to learn how to set this up. Click here.