10. Trading Systems
This section is devoted to both simple and more sophisticated trading systems, which can be used by traders. All trading systems will have representative Amibroker AFL's posted to help you to experiment and create your own. You are encouraged to use and send me feedback at [email protected] regarding the materials posted here.
10.1 Moving Average Based Trading
A basic system which is based on the above concept has already been posted in the Introduction to Chart Analysis Section. Follow the link. Basic Trading System based on Moving Averages
10.2 Moving Average Based Trading (Advanced)
A more sophisticated system that utilizes multiple moving averages and gives multiple entries and exits, that can be used in trending markets is also enclosed here.
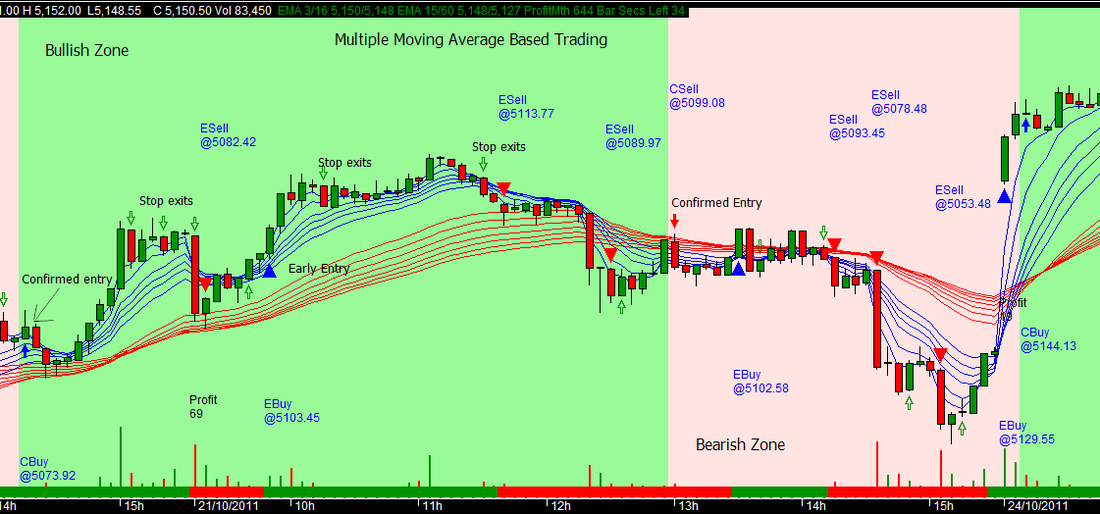
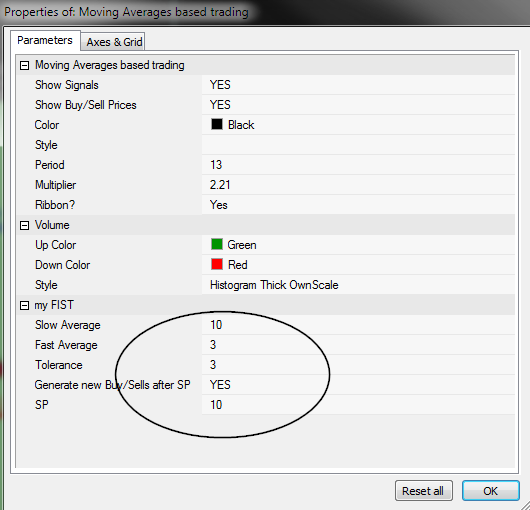
Explore the parameters for settings of your choice. The main settings are the Slow Average, the Fast Average and the Tolerance parameters. The last helps in noise cancellation. You may also suppress the signals and chance the stop profit levels.
| moving_averages_based_trading.afl |
10.2a Choice of Moving average crossovers
Explore the newly added lower lag moving average formulas in section 10.5.
Here are the common average periods used for moving average - MA crossover indicators:
10 periods - Most widely used for trend following indicators. If price is above the 10 EMA, the trend is considered up and down, if below it.
15 periods - A good slow cross over MA or EMA for use with the 10 period EMA for a trend following trading system.
21 periods - Alternative to the 15 period MA or EMA and indicates the status of the medium term trend.
50 periods - Medium term trend indicator. Combined with a low lag moving average provides a good option for a trading system.
200 periods - Used by long term traders to stay invested or exit whether price is above or below this average.
Intraday and short term traders can combine several of these average to build trading systems that give good acceptable results in trends. Use EMA's for the signal generation and MA's as the baseline slow average.
10.3 Opening Range Breakout Trading (ORB)
Unlike moving average based trading, which are intrinsically linked to the price throughout the trading period, the Opening Range trading method, utilizes the early period of the day to determine the trading range. Originally, intended as an intraday trading system, there is no reason, why this cannot be used for positional and longer term trading with appropriatey adjusted rules. What is important is to note its important features:
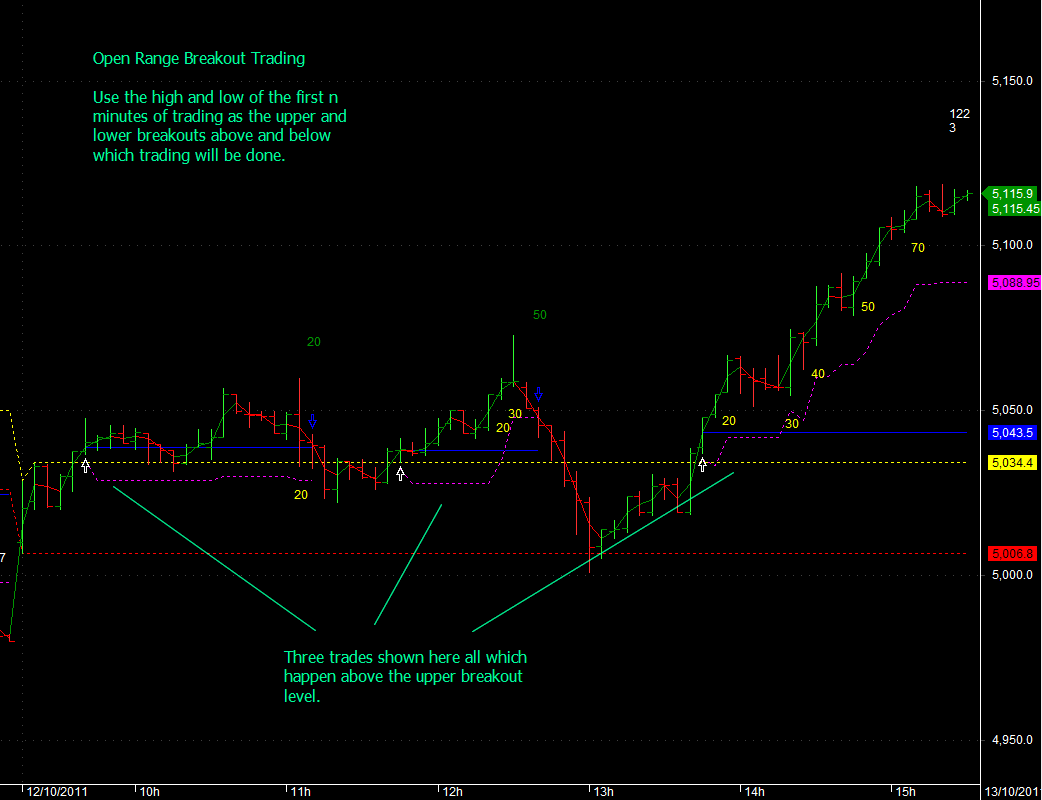
In the intraday version of Opening Range trading, we will note the high or low of the day say for the first 5 or 10 or 15 or 20 or 30 minutes or 1 hour and take either the high and lows as the upside and downside breakout levels. The time period that you choose is one that you can arrive by experimentation. You will get good results, even if you just use 5,10 or 15 minutes as your range break out levels. The concept behind this is that the market opening range determines the bullish and bearish levels for trading. Above the high level, the market is bullish, and below the low level, its bearish. In some sense this is a market mean for the trading period. For use in positional trading, you could use a range that could extend to as much a 1-2 hours on hourly charts and even a day for long term positional trading for calculating the range level.
Long trades are initiated above the high level, while short trades are initiated below the low levelof this period. See the chart below, where we were able to catch a trend well made 122 points in 3 trades. :
And see what it does in range bound days:
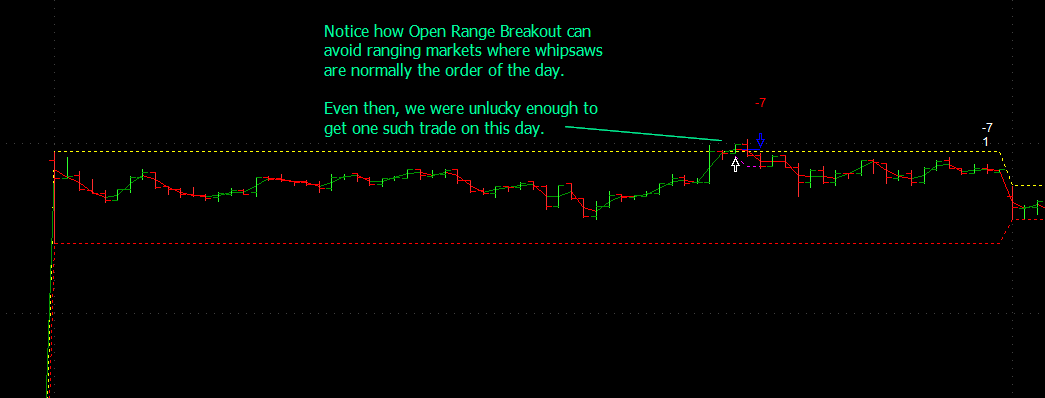
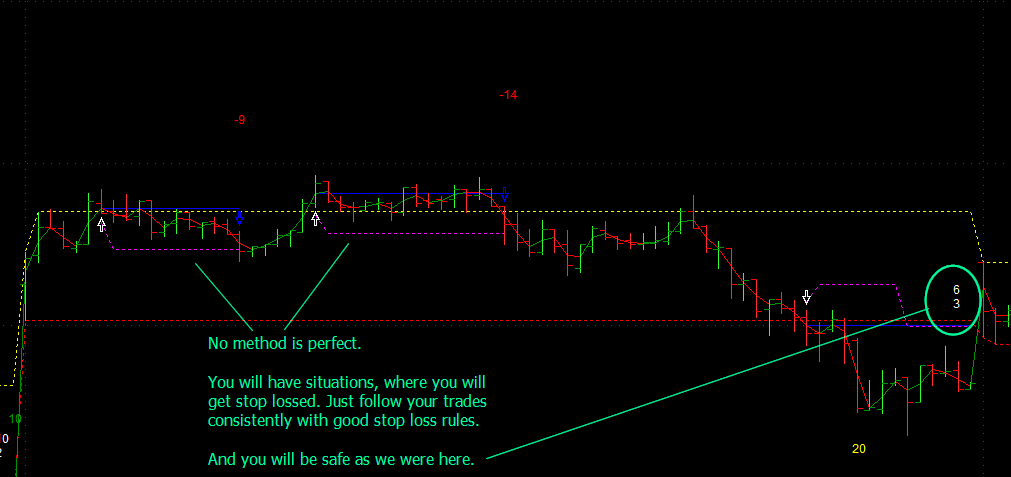
It works most times, but be prepared for situations such as these:
An AFL that you can use is attached. This will be enhanced with more advanced features.
| orb_afl_31-10-2011.afl |
10.4 Special ORB - Using a single level
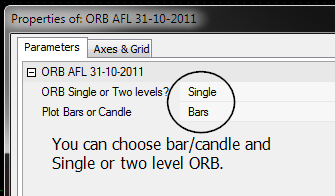
In the ORB method described in 8.3 above, you may think that you lose part of the trading profits based on the volatility that determines your opening range breakout levels. Well, there is a simple answer to that. Switch to a single level which can be one of the following:
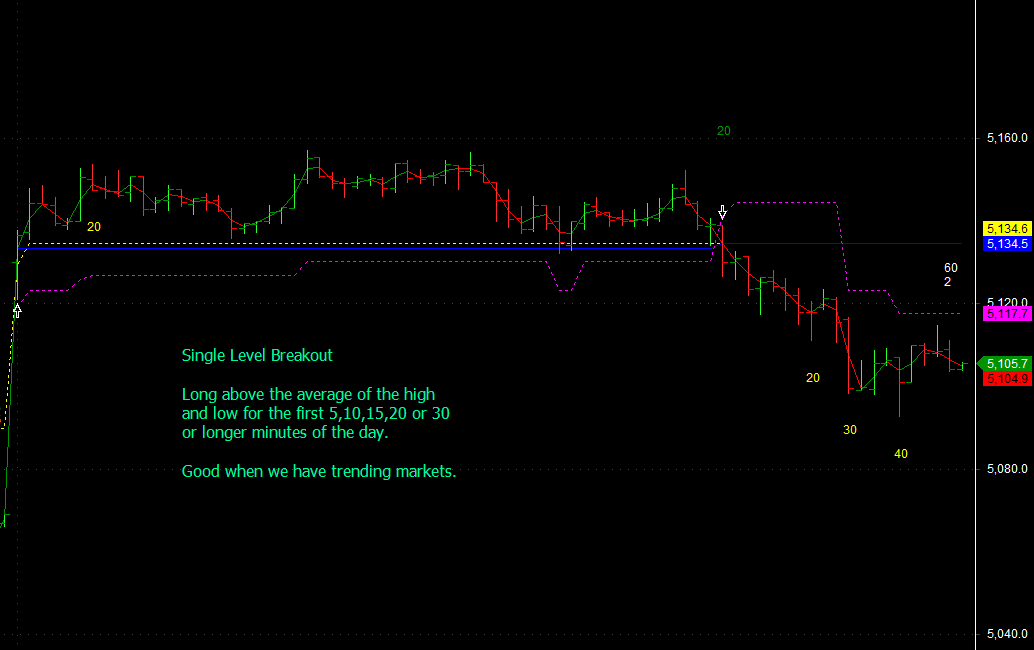
By simply taking the average of the high and low of the selected period, you can work with a single level where the long is above the average level and short is below the average level. This is like a market average for trading purposes.
Single level ORB 1 = (High+Low)/2 of the first n minutes. n=5,10,15,20,30 minutes or 1 hour based on your choice or continuous throughout the day. Read this with the other comments given there regarding extending the concept for positional trading, where your average of the high and low could be for 1-2 hours or even a day and maybe a week in the case of longer periods.
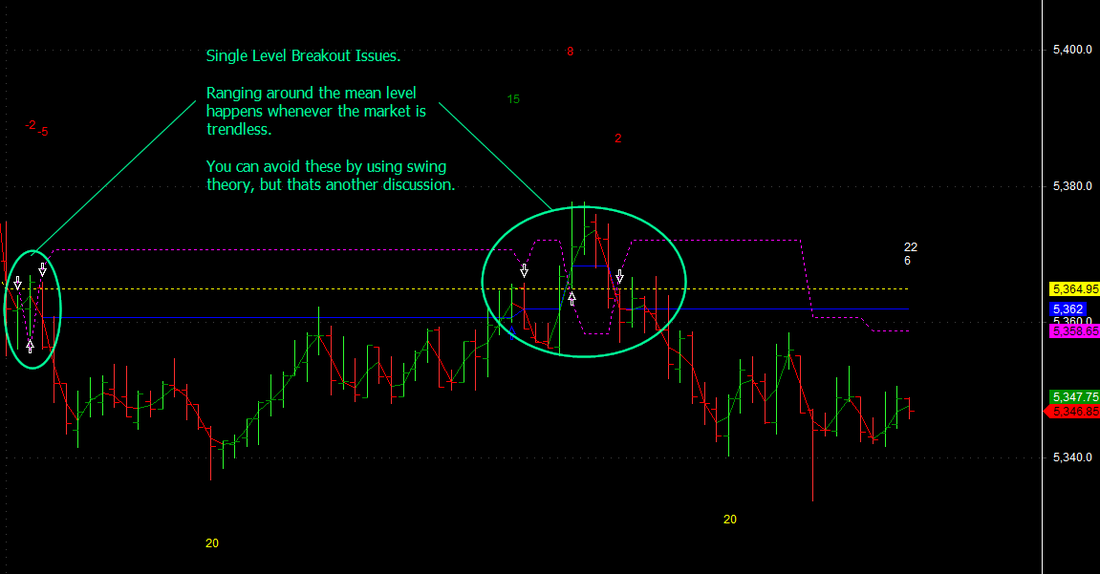
Be prepared for ranging whipsaws around the ORB level when the market is not having direction.
See the charts below:
By simply taking the average of the high and low of the selected period, you can work with a single level where the long is above the average level and short is below the average level. This is like a market average for trading purposes.
Single level ORB 1 = (High+Low)/2 of the first n minutes. n=5,10,15,20,30 minutes or 1 hour based on your choice or continuous throughout the day. Read this with the other comments given there regarding extending the concept for positional trading, where your average of the high and low could be for 1-2 hours or even a day and maybe a week in the case of longer periods.
Be prepared for ranging whipsaws around the ORB level when the market is not having direction.
See the charts below:
And see the whipsaws that can occur. These can be avoided by various noise cancellation techniques, that we will discuss later.
Check out the implementation of ORB systems on Point and Figure charts in section 15. Click here.
Should you have any suggestions or contributions, please write to me at [email protected] or post you comments in the forum
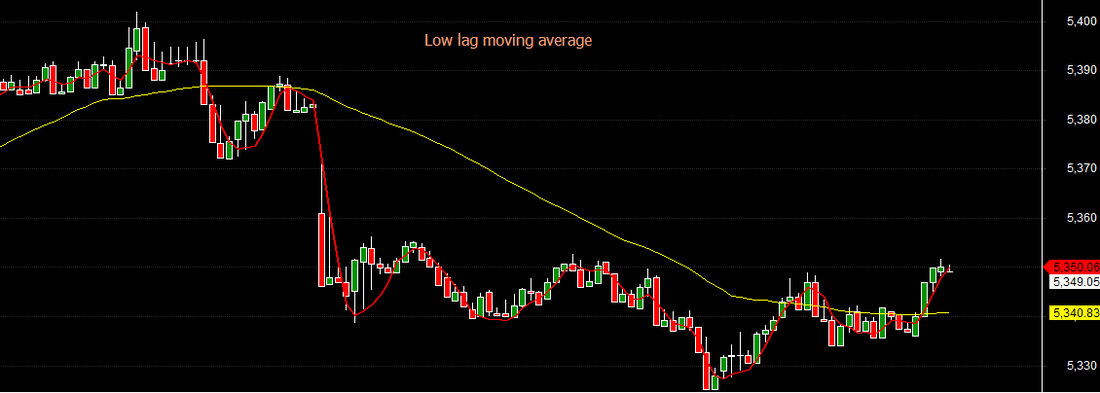
10.5 More Responsive moving average and noise removal
The traditional simple and exponential moving averages provide trading signals which are not as responsive as traders would like, leading to a significant part of the trade getting over when using these average. Of course, when there is a long trend in progress, all moving average based trading systems will perform well.
There is a lot of information on lower lag moving average, and the one which is easily available in the public domain is the Hull moving average. I have read about Jurik as well, but am not sure whether the right formulas are available.
Posted below is an AFL which provides a low lag moving average which has been combined with a standard 50 period moving average to show how it may generate buy and sell signals.
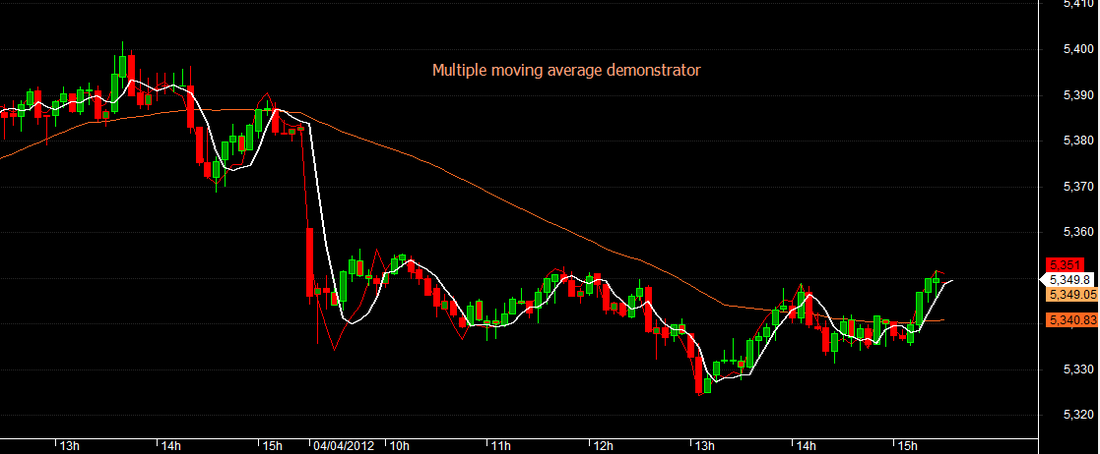
And below that is another AFL which allows you to plot different types of moving averages which could become part of your trading arsenal. Both of these are from public sources on the internet.
You can easily make a trading system by either using as shown below with a 50MA cross over or two other periods say, 10 and 15 periods.
There is a lot of information on lower lag moving average, and the one which is easily available in the public domain is the Hull moving average. I have read about Jurik as well, but am not sure whether the right formulas are available.
Posted below is an AFL which provides a low lag moving average which has been combined with a standard 50 period moving average to show how it may generate buy and sell signals.
And below that is another AFL which allows you to plot different types of moving averages which could become part of your trading arsenal. Both of these are from public sources on the internet.
You can easily make a trading system by either using as shown below with a 50MA cross over or two other periods say, 10 and 15 periods.
| lowlaghulljma.afl |
| multiple_ma_plot.afl |