Please help to make this a success. Please share your contributions to [email protected]. All contributions will be acknowledged here, wherever they are posted. Use the blog for any comments and suggestions.
18. AFL Library - UNiquely USEFUL - UPDATED FEBrUARY 1, 2015
Just the beginning. A resource of useful practical AFLs. Please note that all original AFL's that are part of the individual technical sections are not reproduced here. Keep checking here for new AFLs that are released by TradeWithMe.
18.1 Linear Regression
Draw Linear regression trendlines.
| linear_regression_plot.afl |
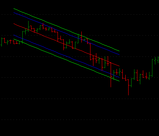
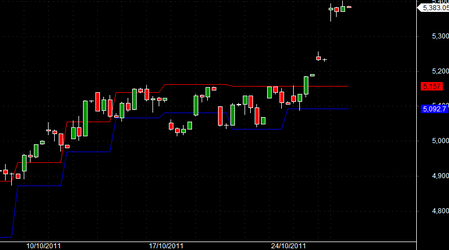
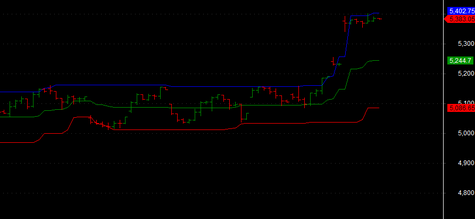
18.2 Square of Nine Roadmap Chart

Used properly, on the basis of a SINGLE bar, Roadmap Charts will produce channels that will pretty much define the overall
future trend that can last anything from days to months or beyond. Example on the left is Nifty futures on 4th November 2011.
| square_of_nine_-_roadmap_charts.afl |
18.3 How far does RSI need to move to cross 30 or 70 levels?
I always used to think about projecting these levels so that one could plan some strategies around price action. Now here is an AFL which does exactly that!
| rsi-projection.afl |
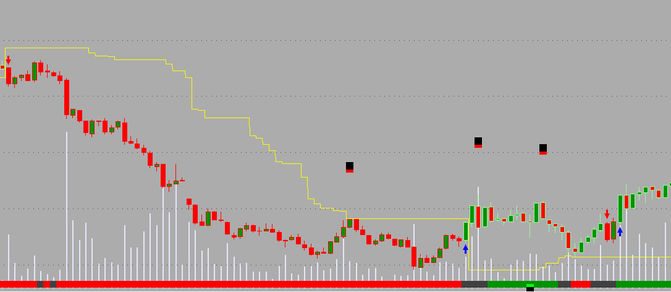
18.4 N Bar Breakout
Reduces the trading noise so that you trade only when there is movement outside of a trading range. This AFL can be used, with or without the time axis. That latter is better for filtering out noise and having a clearer direction on trends. Advisable to use the 3 bar breakout. You can also compare this with Point and Figure charts (PnF). The only difference, being that PnF charts change columns only when there is a change in direction only.
| n-bar-breakout-epotasch.afl |
18.5 Fibonacci Retracements along with Elliot Wave
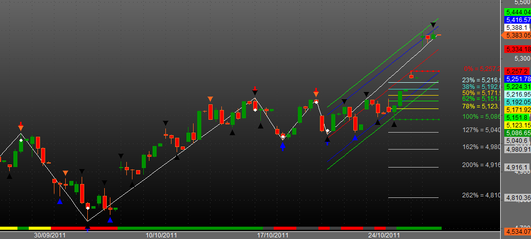
Contributed by JR Julius from his database
This AFL plots Fib retracements from High/Lows in the right context of price movement. Also included is the Elliot wave movement. Elliot wave explanations will be provided as one the trading concepts in the main TA section.
This AFL plots Fib retracements from High/Lows in the right context of price movement. Also included is the Elliot wave movement. Elliot wave explanations will be provided as one the trading concepts in the main TA section.
| fibonacci_retracements__elliot_wave.afl |
18.6 Darvas Box
Contributed by JR Julius from his database
A trading strategy that was developed in 1956 by former ballroom dancer Nicolas Darvas. Darvas' trading technique involved buying into stocks that were trading at new 52-week highs with correspondingly high volumes.
A Darvas box is created when the price of a stock rises above the previous 52-week high, but then falls back to a price not far from that high. If the price falls too much, it can be a signal of a false breakout, otherwise the lower price is used as the bottom of the box and the high as the top.
Read more: Investopedia, BreakoutReport, Boxcharts,GuppyTrading
See more: NicholasDarvasTrading, http://www.youtube.com/watch?v=2RreSLmPLoU
| darvas_box_1.1.afl |
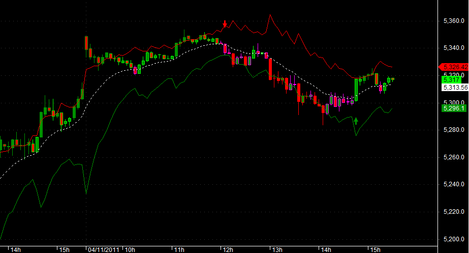
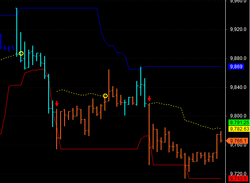
18.7 Donchian Channel
Contributed by JR Julius from his database
The Donchian channel is an indicator used in market trading developed by Richard Donchian. It is formed by taking the highest high and the lowest low of the last n periods. The area between the high and the low is the channel for the period chosen.
It is commonly available on most trading platforms. On a charting program, a line is marked for the high and low values visually demonstrating the channel on the markets price (or other) values.
The Donchian channel is a useful indicator for seeing the volatility of a market price. If a price is stable the Donchian channel will be relatively narrow. If the price fluctuates a lot the Donchian channel will be wider. Its primary use, however, is for providing signals for long and short positions. If a security trades above its highest n periods high, then a long is established. If it trades below its lowest n periods low, then a short is established.
Originally the n periods were based upon daily values. With today's trading platforms, the period may be of the value desired by the investor. ie: day, hour, minute, ticks, etc.
Further Reading : Wikipedia,
See more: Youtube, Youtube-1
| donchian_channel.afl |
18.8 Turtle Trading
The story of how a group of non-traders learned to trade for big profits is one of the great stock market legends. It's also a great lesson in how sticking to a specific set of proven criteria can help traders realize greater returns. In this case however, the results are close to flipping a coin, so it's up to decide if this strategy is for you.
Turtles were taught very specifically how to implement a trend-following strategy. The idea is that the "trend is your friend", so you should buy futures breaking out to the upside of trading ranges and sell short downside breakouts.
A turtle trading system is attached along with.
Read more: http://www.investopedia.com/articles/trading/08/turtle-trading.asp#ixzz1cpt0C1ev
The original Turtle rules are attached in the enclosed PDF file.
Read More at : Wikipedia, Technical-Analysis,
See More at : Youtube
| turtle_trading_.afl |
| turtlerules.pdf |
18.9 KPL Swing Indicator
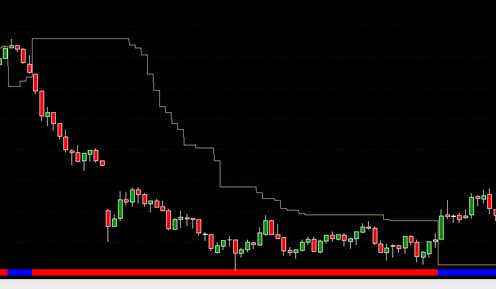
The KPL Swing is a simple trend following mechanical trading system which automates the entry and exit.
The trading system is extremely simple and easy to use, works across multiple time frames and does not require any in-depth knowledge of TA. It is somewhat similar to the turtle trading system.
The trading or investing logic is simple.... buy new highs (strength) and sell new lows (weakness). The default entry or decision level for long positions is a close above 20 days highest high.
Trading signals - see the AFL comments inside the AFL.
Credit to : VfmDirect
| kpl_swing_2.afl |
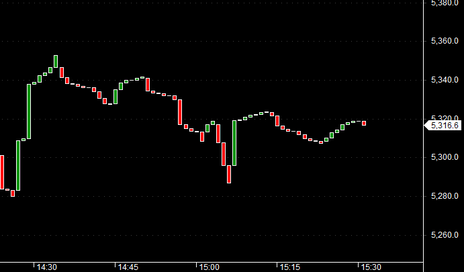
18.10 Intraday Swing Trading System
This is an interesting swing trading system, which you can paper trade first and then use.
| intraday_swing_trading.afl |
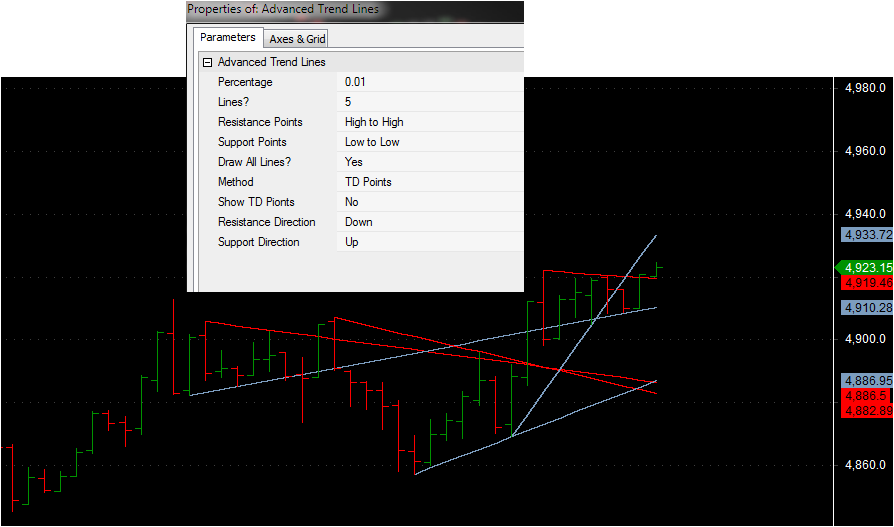
18.11 Advanced Trend Line
Excellent AFL for plotting trend lines. You can vary the sensitivity to suit your requirements. It allows you to choose different options for support and resistance points as well as support and resistance directions, thereby providing a great amount of flexibility in plotting the trend lines.
| advanced_trend_lines.afl |
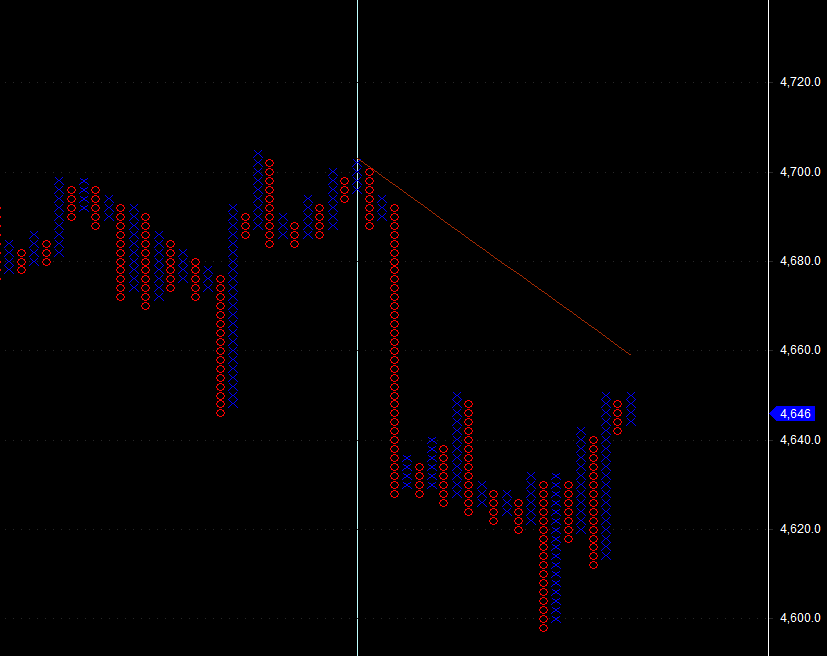
18.12 Point and Figure charts AFL
Here is an AFL written by Graham Kavanagh for reproducing Point and Figure charts in Amibroker. Its an approximation, but will work to understand the PnF concept. For more serious use, I would suggest a platform like Bulls Eye Broker.
| pnf_graham_k_17_april_2004.afl |
18.13 Days to expiry and more for Indian stock markets
For Indian stock markets the expiry date is the last Thursday of the month. The enclosed AFL is exclusive. It can do any of the following:
- Indicate whether the current day is expiry day or not.
- Date of expiry for current or any forward month.
- Days to expiry this month or any future month.
- By selecting any bar in existing data charts, one will also get the expiry for the current month.
This is constructed as an Amibroker function and hence can be added to any existing indicator.
| daystoexpiry.afl |
18.14 Camarilla REVISED
The Camarilla AFL has been revised to avoid repainting of the buy and sell signals. Additionally, an improved implementation to reduce whipsaws.
Click here for the Camarilla page to download the new AFL.
Click here for the Camarilla page to download the new AFL.
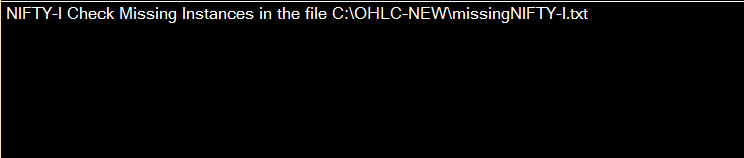
18.15 Detecting data gaps
|
How frustrating is it when you dont know if you have gaps in your data. The enclosed AFL detects if there are missing days in your database conveniently, by giving a message in the title and a text file with gaps information or all ok and no missing data .
This AFL works with or without any holidays data. If the holidays data is not provided, gaps in the data other than the weekends (saturday and sunday) will be shown. The sample of the holidays file is also attached. A future upgrade will include missing intraday data detection too. |
|
| ||||