Nifty Futures Trend from TradeWithMe - For the most tension free and readable forecasts on the market trend!
Nifty Trend

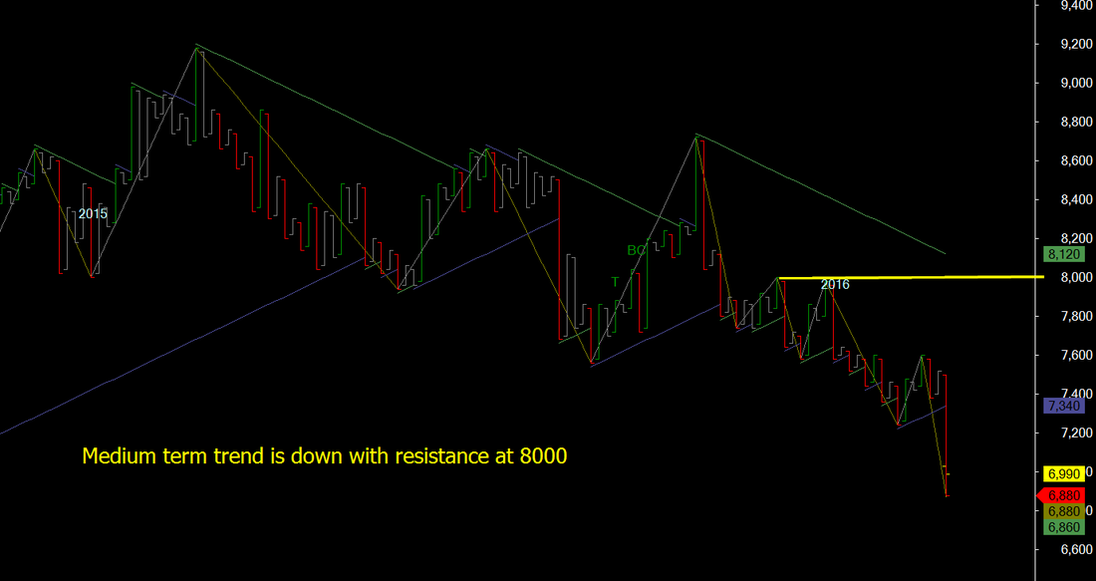
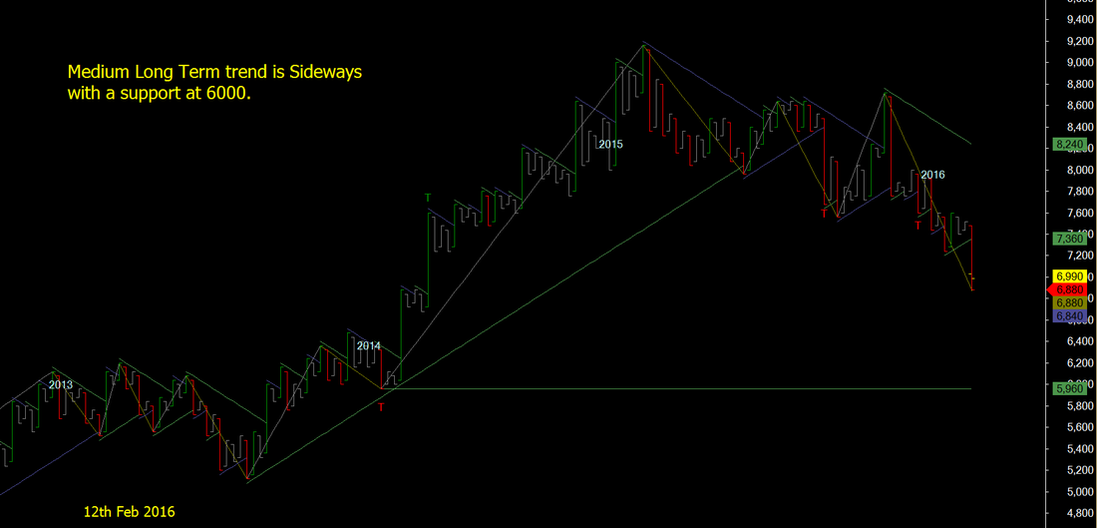
Markets are now trending sideways with support at 6000 and resistance at 7600.
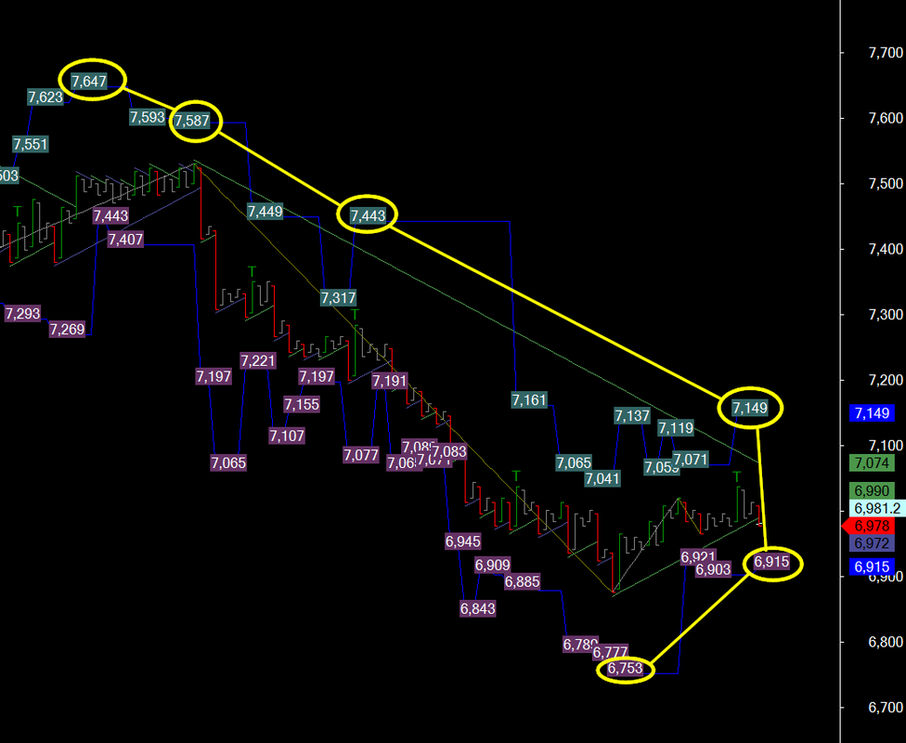
Long term charts updated - Updated Feb 12, 2016.
Read about Trading Futures and Options here (click)
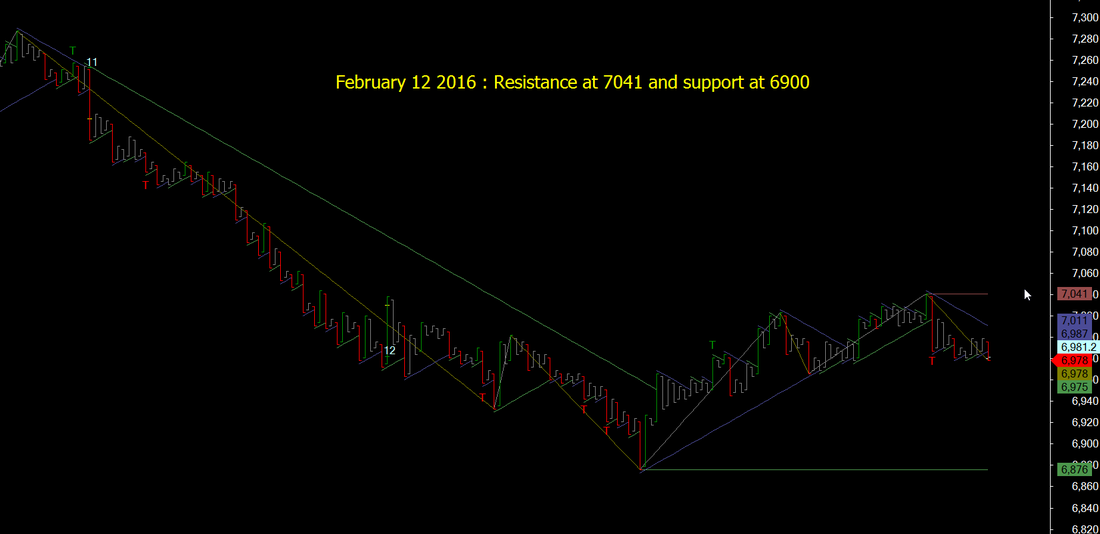
Nifty Futures Trend Forecast February 12, 2016 (click any image for a larger view)
(Point and Figure Charts design and presentation TradeWithMe Proprietary)
TrendS Jan 2016
Intraday setup : Trend is Down
Short term : Trend is Down
Medium term setup (60-90 days) Down
(All figures are for Nifty Futures)
Other Trends:
MEDIUM LONG TERM TREND (Months) : Sideways.
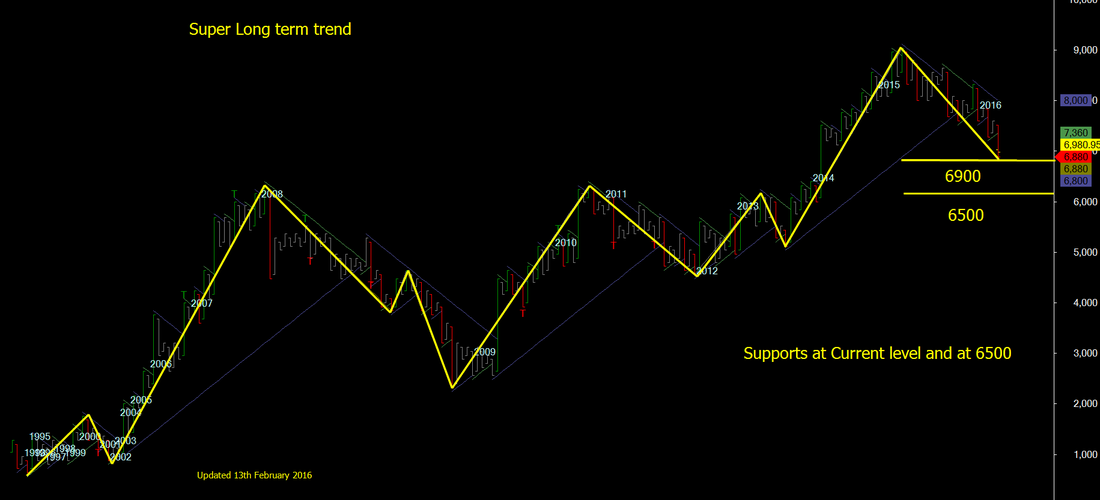
LONG TERM TREND (Years): up.
Investment positions - Buy on dips gradually as market corrects.
All trading calls are now available free. Try LiveScreen by using the link (click here to ask more)
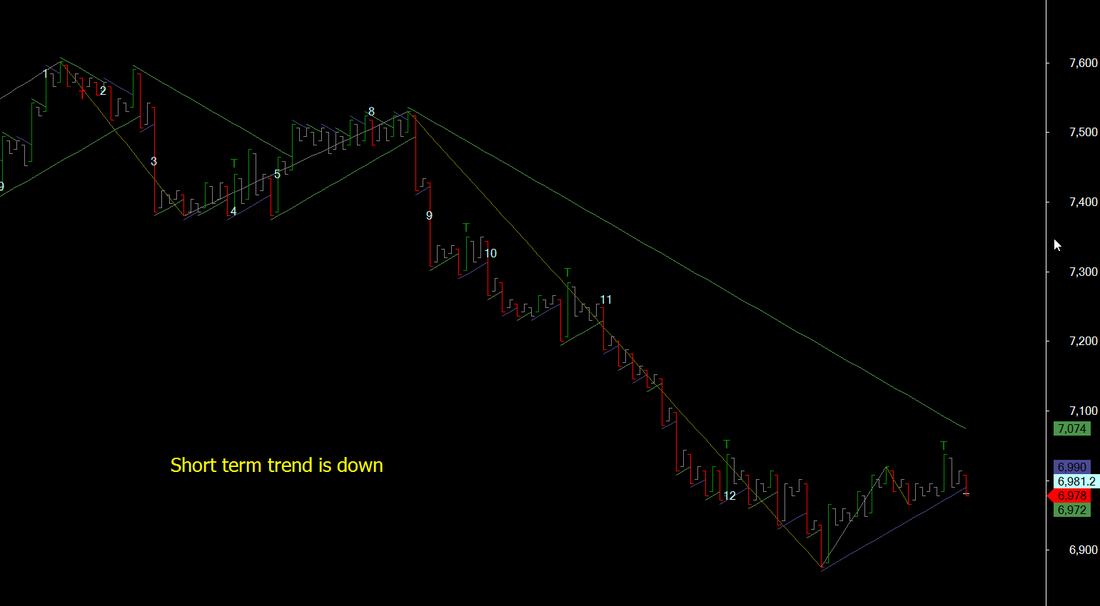
Short term : Trend is Down
Medium term setup (60-90 days) Down
(All figures are for Nifty Futures)
Other Trends:
MEDIUM LONG TERM TREND (Months) : Sideways.
LONG TERM TREND (Years): up.
Investment positions - Buy on dips gradually as market corrects.
All trading calls are now available free. Try LiveScreen by using the link (click here to ask more)
The numbers represent days of months or months as appropriate
Super long term projection with 23 years NF SPOT data
We remain in an uptrend on the long term charts with possible reversals from current/6500 levels.
Resources and Information
Forecasts and updates are made based on technical parameters and provided for information only. These are not trading calls.Any interpretation or subsequent use is at the readers risk.
SGX Nifty Live - http://www.forexpros.com/indices/india-50-futures-advanced-chart or http://www.sgxlive.in/
BANKNIFTY trading is a paid service from January 1 with a performance of close to 3000 points per month during the pilot service period, please check here http://www.tradewithme.me/services-offered.html.
Also look at the positional levels of select stocks at http://www.tradewithme.me/positional-calls-nifty-stocks.html (click the link)
(Short term positional list will change, while long term positional levels will be carried forward to track performance)