16 Simulating your trades
16.1 Introduction
How often have you developed your trading system and then while using it enter trades at prices that are different from entries given by the theoretical system and again, exits which are different from your system generated exit. You may have wondered that it would be a good idea to be able to enter your real trades on a price chart and see the results as you trade, namely, the profit of one or more trades. We are not talking of back testing your system logic, but about the ability to record and see the impact of how you are really trading.
What should be the requirements of such a system? Lets go through that :
Step 1: On the price chart we should be able to enter every buy and sell signal at the exact price that we enter.
Step 2: We should be able to enter our stop loss level and trail it if the trade becomes profitable. We should be able to specify the stop loss if the trade doesnt succeed and the trailing stop approach. For the moment, we will assume that we will trail stop a specified number of points from the maximum profit.
Step 3: We should be able to enter multiple trades.
What could be the benefit of such a system? Clearly, being completely parameterised, you could test emperical concepts such as Elliot Wave or Camarilla or breakout trading, in a simulated environment, without caring about any knowledge about programming. Once you are comfortable with a basic trading system, you could get down to actually scripting it on an analysis platform. Or you could just document your real trades as a journal for record, save the screen shots everyday into your archive for periodic review.
The work done here is completely original work, developed to resolve a practical real world issue.
16.2 Examples of simulation
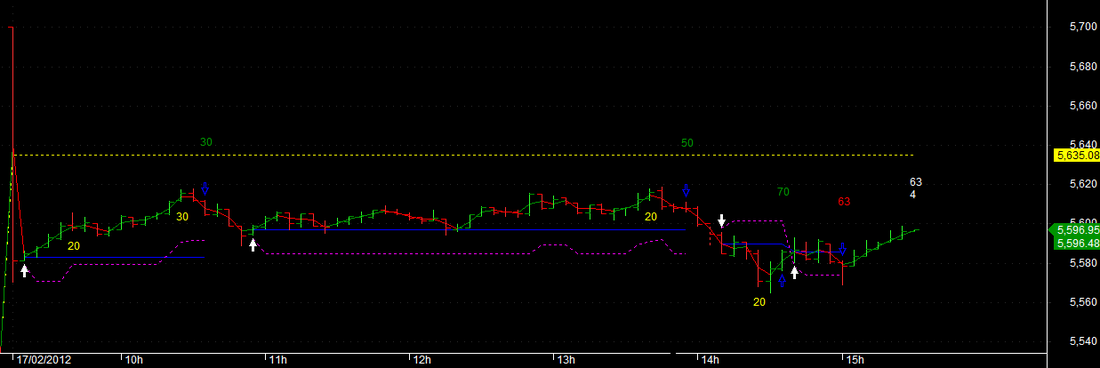
Here is the chart of my trades on 17th February plotted through a simulation script that I wrote. This was done by modifying an existing trading system so that buy and sell signals were replaced with the actual real trades, indicated by the levels of the blue lines with entries at the white arrows and exits at the blue arrows. Thats one way, we may want to use such a facility.
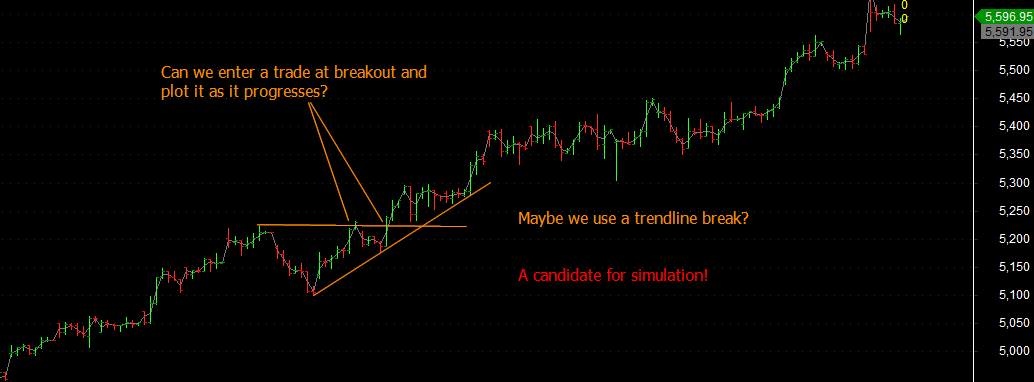
Lets say, we want to simulate the entry of a trade on a breakout using the concept of higher highs and price rising above the last high. Here we want to track a trade on a ongoing basis. Another candidate for simulation.
The solution for this is provided at the end of this section in section 16.8.
The solution for this is provided at the end of this section in section 16.8.
16.3 Plotting real trades in Amibroker
There are two ways to communicate with Amibroker to do such a simulation. One is to use the feature of external studies, or trend lines which can be drawn and programatically using the intersection of the price line with the study to generate a buy or sell signal. Its best to use the vertical study line as shown in the next paragraph. This was the approach followed in the previous version of the simulator.
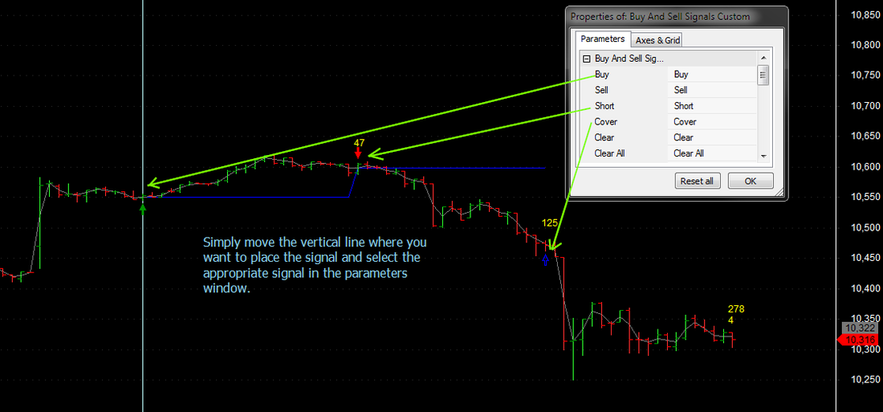
In the new version of the simulator, you simply select the vertical bar location on the chart where you want to put a Buy, Sell, Short or Cover signal, and use the ParamTrigger function to communicate with Amibroker.
See the following simple code which helps you to generate these simulation lines. The best part of this code is that it can be used in any time frame.
SetBarsRequired(10000, 0 );//Makes sure that your signals do not move - enough bars are loaded.
avp=(O+C)/2; // generating an average price line. You could use just close as well.
setbuy = ParamTrigger("Buy", "Buy" ); // ParamTrigger function used to generate a Buy Signal
setsell = ParamTrigger("Sell", "Sell" ); // ParamTrigger function used to generate a Sell Signal
setshort = ParamTrigger("Short", "Short" ); // ParamTrigger function used to generate a Short Signal
setcover = ParamTrigger("Cover", "Cover" ); // ParamTrigger function used to generate a Cover Signal
clear = ParamTrigger("Clear", "Clear" ); // ParamTrigger function used to Clear the current signal (selected)
clearall = ParamTrigger("Clear All", "Clear All" ); // ParamTrigger function used to clear all signals.
bi = BarIndex(); //Current bar index
sbi = SelectedValue( bi );//Selected chart position - vertical line
qty = LastValue( bi );// last value of bar index
Varname = Name() + sbi;//Static variable being set
if( setbuy )
{
StaticVarSet( Varname, 1 );//Static variable stores the appropriate signal, Buy here.
}
if( setsell )
{
StaticVarSet( Varname, -1 ); //Static variable stores the appropriate signal, Sell here.
}
if( setshort )
{
StaticVarSet( Varname, -2 ); //Static variable stores the appropriate signal, Short here.
}
if( setcover )
{
StaticVarSet( Varname, 2 ); //Static variable stores the appropriate signal, Cover here.
}
if( clear )
{
StaticVarRemove( Varname );//Removes currently selected signal
}
if( clearall )
{
for( i = 0; i < qty; i++ ) StaticVarRemove( Name() + i );//clears all signals
}
Buy = Sell = Short = Cover = 0;
for( i = 0; i < qty; i++ )
{
sig = StaticVarGet( Name() + i );
if( sig == 1 ) Buy[ i ] = True;//assign the signals to the right arrays.
if( sig == -1 ) Sell[ i ] = True;
if( sig == -2 ) Short[ i ] = True;
if( sig == 2 ) Cover[ i ] = True;
}
Plot(avp, "Mid", IIf(avp>Ref(avp,-1),colorGreen,colorRed), styleNoTitle );
shape = Buy * shapeUpArrow + Sell * shapeHollowDownArrow;PlotShapes( shape, IIf( Buy, colorLime, colorRed ), 0, IIf( Buy, Low, High));
Remember to delete all signals using the Clear All parameter while starting a new session, otherwise, the signals will not be shown for the new trades.
16.4 Putting it all together
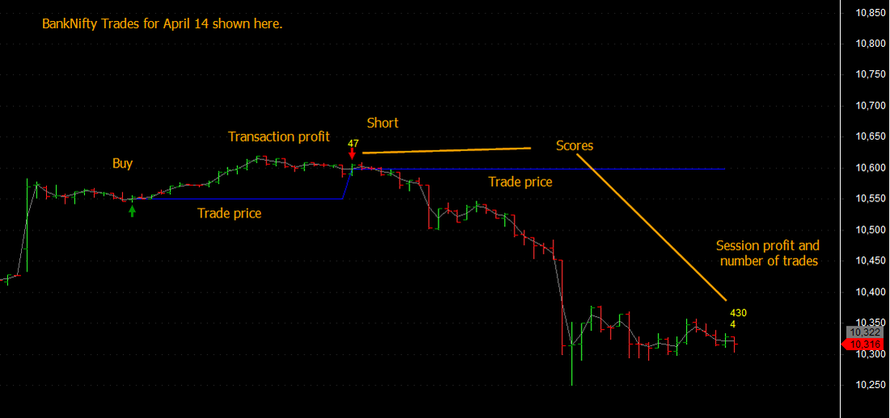
If you want to simulate buy followed by a signal reversal to a short which simply implies selling twice the buy quantity, you can do that by not using the sell signal for the buy, but putting a short signal straightaway. The same applies in the reverse, if you want to short and then follow it up with a signal reversal to a buy. This is shown in the short signal above.
16.5 Trade simulation example completed
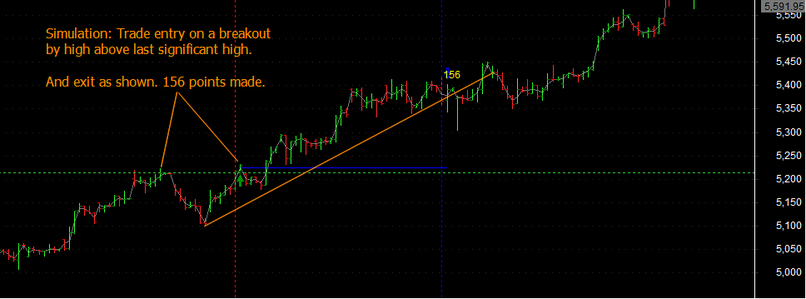
We simulate a trade entered at a breakout above the last high and exit some 156 points later on a trend line break.
No programming, just basic patterns with trend lines. Trading couldn't be simplified as is done here! The simulations shows how profitable the trade or set of trades is.
No programming, just basic patterns with trend lines. Trading couldn't be simplified as is done here! The simulations shows how profitable the trade or set of trades is.
16.6 The final Amibroker AFL
Have fun. And if you like it, let me know.
So here are the steps to use the AFL.
Once installed on Amibroker insert the vertical study lines with labels b1, b2 etc for buy signals and s1, s2 etc for short signals and e1, e2 etc for the exit signals. The AFL automatically recognises the context of the exit for a buy or sell signal. Remember that the buy and sell signals are generated one bar after the vertical position of the study line. This has no practical impact on entering your trade signals.
Next you can modify the trade entry and exit values, if required in the parameter windows and you have your trade journal ready!
To re-use the AFL for another trading session, please remember to delete all the existing studies, by right clicking in the display area and selecting delete all studies and resetting the parameter window to remove any custom buy/short or exit prices.
The AFL will be extended to include stop losses in the next major section on stop losses and exit approaches.(done..see below).
Important : When the AFL used in a live environment with the new version with Buy/Sell signals added through parameter window, the signals were moving their positions when more bars were getting added. Thats been fixed.
| buy_and_sell_signals_custom_.afl |
16.7 Enhanced Trade Simulator with ATR based stops
Please go to the end of Trading Systems VIII Stop Losses and have a look at the enhancements. The AFL is also placed here for convenience. You will need to read the stop loss section to understand the enhancements done and examples.
26-4-2013 : Modified to allow signals on the last bar as well.
29-4-2013 : Allowed ATR stop to be used optionally, so that you can use your own stop loss system externally.
26-4-2013 : Modified to allow signals on the last bar as well.
29-4-2013 : Allowed ATR stop to be used optionally, so that you can use your own stop loss system externally.
| buy_and_sell_signals_custom_with_atr_stop_2.0.afl |
16.8 Coming Soon
Ability to record your trades in an excel spread sheet and uploading these into the simulator. Likewise, writing out the trades that you plot into a file, which can be then stored as a historical record or loaded into an excel spreadsheet for analysis.