5. Chart Patterns
5.1 Introduction
Irrespective of the kind of charts that you use, there are frequently patterns which are formed which signal a major or minor move, a continuation or reversal. Apart from the major patterns that are covered here, another specialised area is that of candlestick patterns. They offer a more granular view of whats happening around the overall chart patterns that we see first. You may think that chart patterns are subjective, and yes they are; many call studying chart pattern as an art and for that many analysts do not focus heavily on them. Irrespective, whether you do or not, you should be aware of what they mean.
5.2 Patterns on a Chart
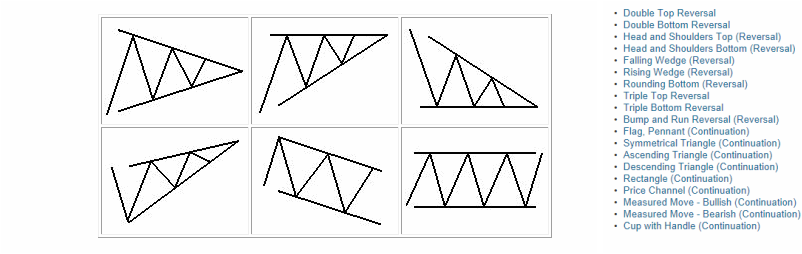
Chart patterns signal to traders that the price of a security is likely to move in one direction or another when the pattern is complete.
There are two types of patterns in this area of technical analysis: reversal and continuation. A reversal pattern signals that a prior trend will reverse on completion of the pattern. Conversely, a continuation pattern indicates that the prior trend will continue onward upon the pattern's completion.
The difficulty in identifying chart patterns and their subsequent signals is that chart use is not an exact science. In fact, it's often viewed as more of an art than a science. While there is a general idea and components to every chart pattern, the price movement does not necessarily correspond to the pattern suggested by the chart. This should not discourage potential users of charts - once the basics of charting are understood, the quality of chart patterns can be enhanced by looking at volume and secondary indicators.
Read more: http://www.investopedia.com/university/charts/charts1.asp#ixzz1c4ixvHzS
There are hundreds of thousands of market participants buying and selling securities for a wide variety of reasons: hope of gain, fear of loss, tax consequences, short-covering, hedging, stop-loss triggers, price target triggers, fundamental analysis, technical analysis, broker recommendations and a few dozen more. Trying to figure out why participants are buying and selling can be a daunting process. Chart Patterns put all buying and selling into perspective by consolidating the forces of supply and demand into a concise picture. As a complete pictorial record of all trading, chart patterns provide a framework to analyze the battle raging between bulls and bears. More importantly, chart patterns and technical analysis can help determine who is winning the battle, allowing traders and investors to position themselves accordingly.
In many waves, Chart patterns are simply more complex versions of trend lines. It is important that you read and understand the materials on trendlines given in the previous sub section.
Chart pattern analysis can be used to make short-term or long-term forecasts. The data can be intraday, daily, weekly or monthly and the patterns can be as short as one day or as long as many years. Gaps and outside reversals may form in one trading session, while broadening tops and dormant bottoms may require many months to form.
Read more at : http://stockcharts.com/school/doku.php?id=chart_school:chart_analysis:introduction_to_char
Some of the common patterns are described here. Please refer to the references to get more details on the patterns described here.
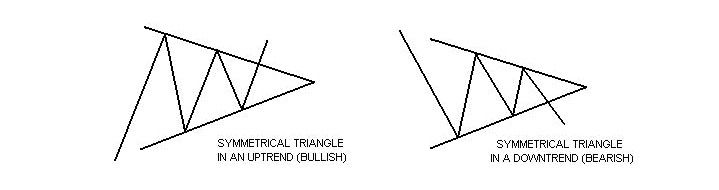
5.2.1 Symmetric Triangles:
Symmetrical triangles can be characterized as areas of indecision. A market pauses and future direction is questioned. Typically, the forces of supply and demand at that moment are considered nearly equal. Attempts to push higher are quickly met by selling, while dips are seen as bargains. Each new lower top and higher bottom becomes more shallow than the last, taking on the shape of a sideways triangle. (It's interesting to note that there is a tendency for volume to diminish during this period.) Eventually, this indecision is met with resolve and usually explodes out of this formation (often on heavy volume.) Research has shown that symmetrical triangles overwhelmingly resolve themselves in the direction of the trend. With this in mind, symmetrical triangles in my opinion, are great patterns to use and should be traded as continuation patterns.
Read more at : http://www.chartpatterns.com/symmetricaltriangles.htm
Read more at : http://www.chartpatterns.com/symmetricaltriangles.htm
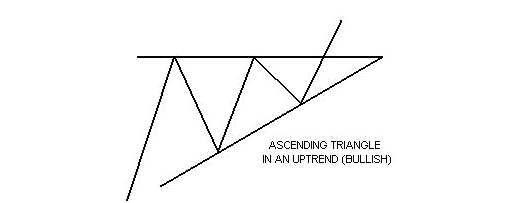
5.2.2 Ascending Triangles:
The ascending triangle is a variation of the symmetrical triangle. Ascending triangles are generally considered bullish and are most reliable when found in an uptrend. The top part of the triangle appears flat, while the bottom part of the triangle has an upward slant. In ascending triangles, the market becomes overbought and prices are turned back. Buying then re-enters the market and prices soon reach their old highs, where they are once again turned back. Buying then resurfaces, although at a higher level than before. Prices eventually break through the old highs and are propelled even higher as new buying comes in. (As in the case of the symmetrical triangle, the breakout is generally accompanied by a marked increase in volume.)
Read more at : http://www.chartpatterns.com/ascendingtriangles.htm
Read more at : http://www.chartpatterns.com/ascendingtriangles.htm
5.2.3 Volume
After looking at the various chart patterns explained so far, you'll notice that consideration has been given to volume. Simply put, volume is the number of contracts traded over a period of time. And since even the most reliable of patterns will fail sometimes, volume can be used as another tool in determining what's happening within the market and more specifically what's happening within the pattern.
It is believed that volume should increase in the direction of the price. If the prevailing trend is up, volume should be heavier on the up days and lighter on the the down days. If the trend was down, volume should be heavier on the down days, with lighter volume on the up days. This makes sense because in an uptrend there should be more buyers than sellers, and in a downtrend there should be more sellers than buyers. If volume should start to diminish, it could be a warning that the trend could be losing steam and that a consolidation or perhaps a reversal could be ahead. If the trend was up, and now we're seeing more volume on dips than on rallies, it should be an alert that buying pressure is waning and sellers are becoming more aggressive. The reverse would be true in a downtrend. If volume starts to shrink on the sell-offs and picks up on the rallies, once again, it could be a sign that the trend is in trouble, and buyers are starting to assert themselves. When volume moves in the opposite direction of the price, this is called divergence.
One of the reasons why volume has a tendency to diminish during periods of indecision is for just that reason. During periods of sideways movement, often traders will avoid a market, preferring to commit their funds once a clear-cut breakout is seen. However, while it's typical for volume to diminish during these times, volume can give clues as to possible future direction by measuring the level of conviction of the buyers and the sellers. Seeing if there's heavier volume on the up days or on the down days could be useful in getting positioned during a sideways move or a formation of a pattern. The idea being that if there's more volume on the up days than the down days, the buyers are probably the more aggressive and the market should more than likely breakout to the upside. The reverse being true if the volume is heavier on the down days, with the market likely to breakout to the downside.
So while it seems as if chart patterns, volume and technical analysis in general all have some forecasting abilities, none are foolproof. Used together, they can be quite helpful in your trading and investing, but should be looked at more as helpful hints as to a markets bias, more than anything else.
5.2.4 More Patterns
Read rest of the patterns at http://www.chartpatterns.com/ as below:
Descending triangles : http://www.chartpatterns.com/descendingtriangles.htm
Head and Shoulders : http://www.chartpatterns.com/headandshoulders.htm
Wedges : http://www.chartpatterns.com/wedges.htm
Flags and Pennants : http://www.chartpatterns.com/flagsandpennants.htm
Rectangles : http://www.chartpatterns.com/rectangles.htm
All figures below are credited to www.chartpatterns.com
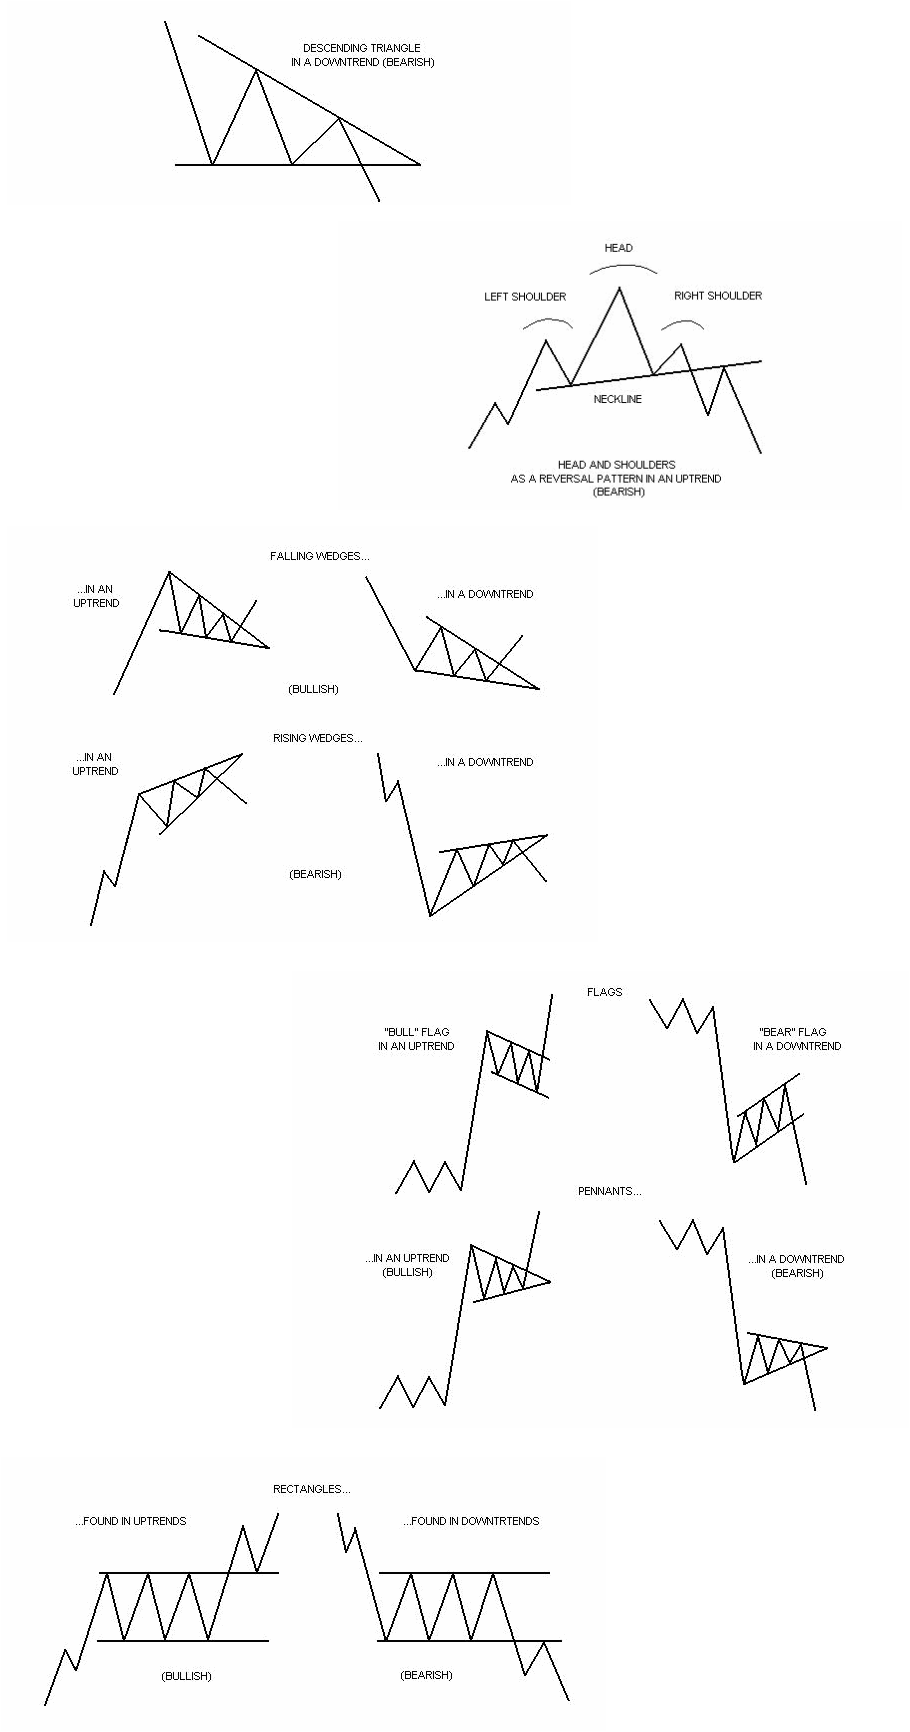
Chart Patterns: More references
Investopedia : http://www.investopedia.com/university/charts/#axzz1c4iayKCC
Stockcharts: http://stockcharts.com/help/doku.php?id=chart_school:chart_analysis:chart_patterns
Babypips : http://www.babypips.com/school/chart-patterns-schmatterns.html
Daytrading : http://www.daytradingcoach.com/daytrading-technicalanalysis-course.htm
Stockcharts: http://stockcharts.com/help/doku.php?id=chart_school:chart_analysis:chart_patterns
Babypips : http://www.babypips.com/school/chart-patterns-schmatterns.html
Daytrading : http://www.daytradingcoach.com/daytrading-technicalanalysis-course.htm
Next steps
Explore the subsequent sections and develop your trading system using the guidelines and formulas or explore our mentored trading offerings (click here).
You are welcome to give your comments, suggestions and feedback (click here). Join us at the forum here(click here) or on Facebook (click here).
You are welcome to give your comments, suggestions and feedback (click here). Join us at the forum here(click here) or on Facebook (click here).