|
Want to know the subtle differences between different charting styles. You may already know most of it, but learning to using the right style that suits your trading profile and then sticking to it is important. Low time frame candle or bar charts. Unless secondary indicators are used, may lead to false trades. See the 1minute chart for BankNifty for most of the day on 11th November 2013 (click any image for a larger view): 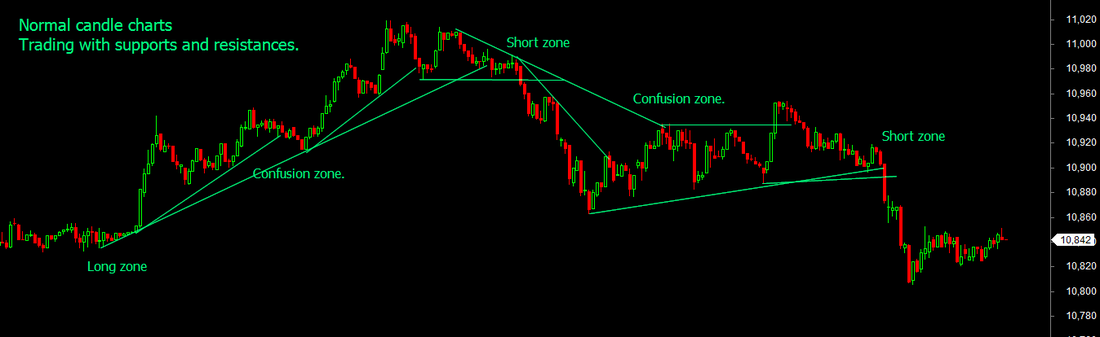 Well, you may say, dont use 1 minute charts and switch to 5 minutes to reduce the noise. Good, a solution, but may sometimes still generate false trades, but more reliable usually. 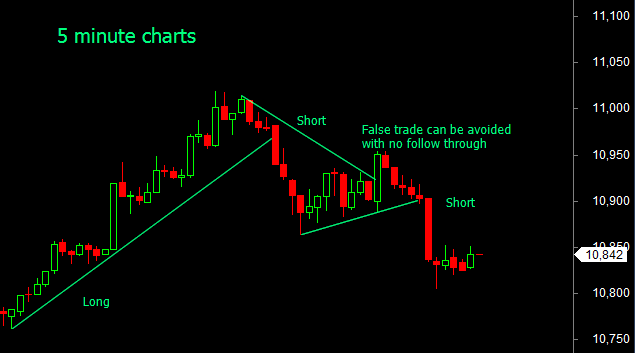 Look at the same chart in our version of the Point and Figure (PnF) method. Trend breaks and follow throughs are the usual rules to enter trades there. The trades seem to initiate late, as PnF is a breakout trading method. However, expert PnF traders can take early trades as shown in the second chart by drawing significant inner trend lines. 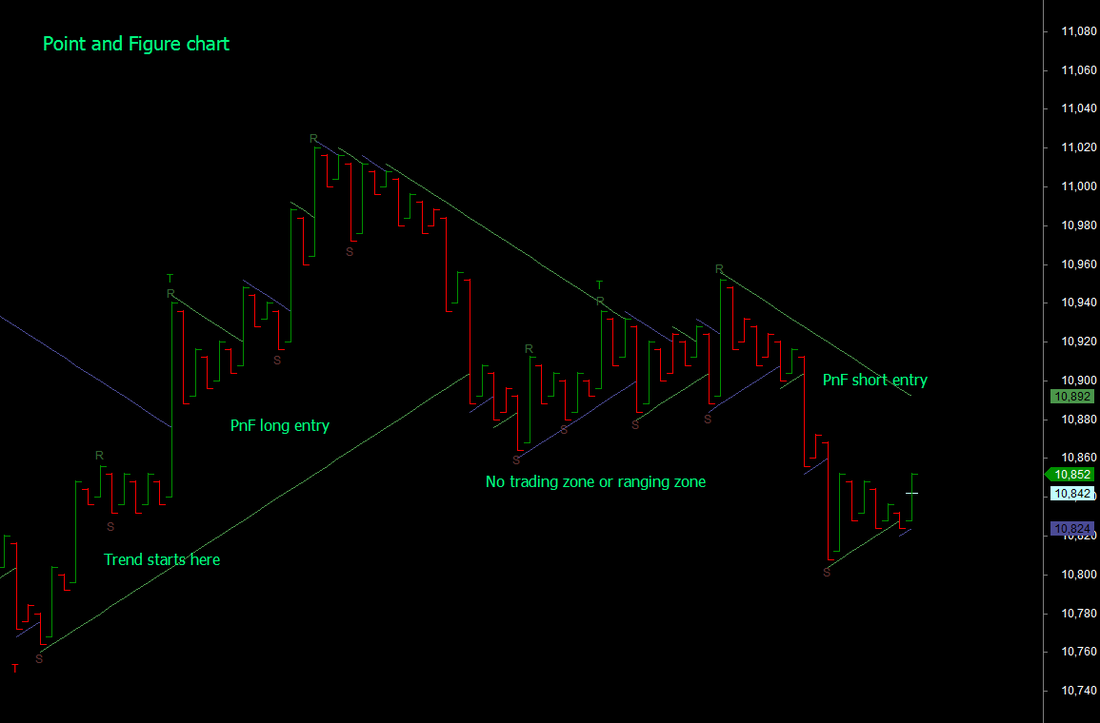 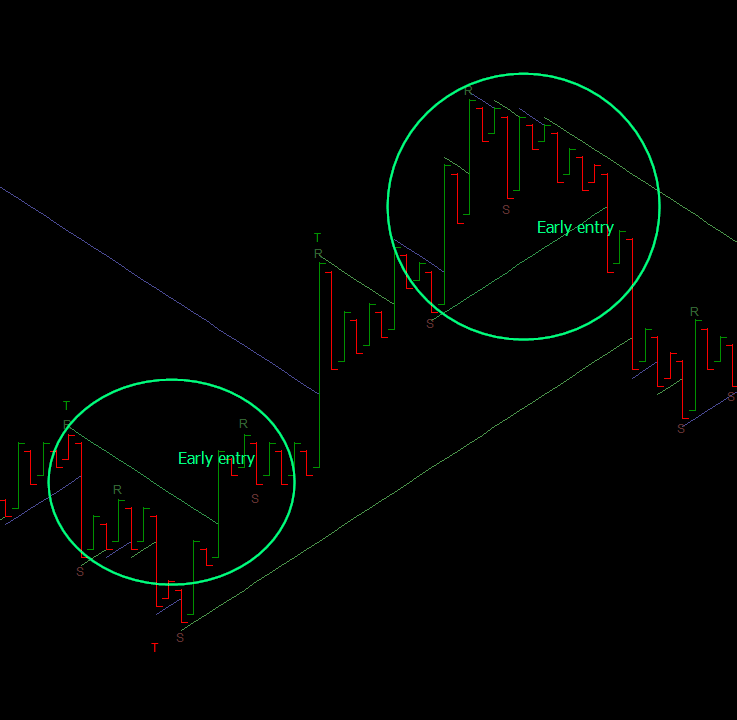 Looking at the same chart using the Renko method, where each move in the vertical columns of the PnF chart gets traced in zig zag 45 degree movements. This certainly allows early trade entries and using 1/2/3 or Elliot wave type of entries. A whole new world of possibilities opens up. 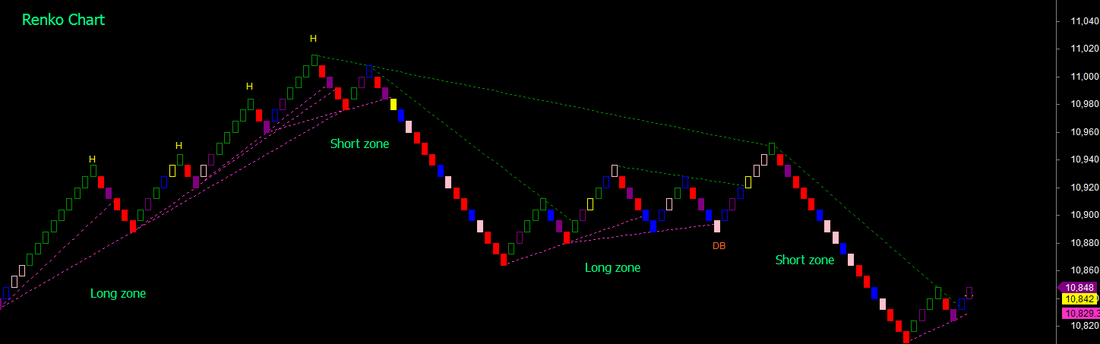 And finally, the Kagi style, where you look at only significant movements of price. See the same chart as above and the possible simpler trades and as indicated in the previous post combining Intraday and positional trades. 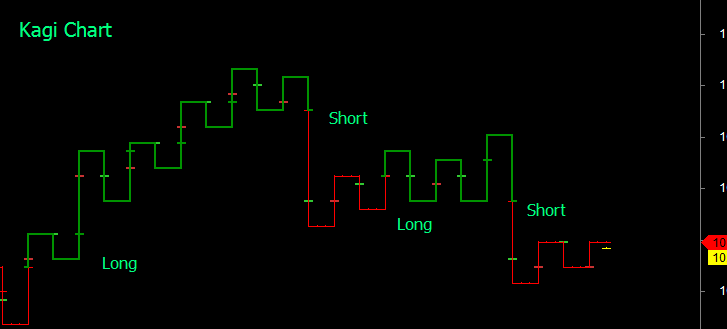 Want to multiply the possibilities for technical wizardy? Apply all your favorite indicators on any of these methods and explore what may happen. Personally, I only look at basic price movements and sometimes volume as everything else is dependent on them.
1 Comment
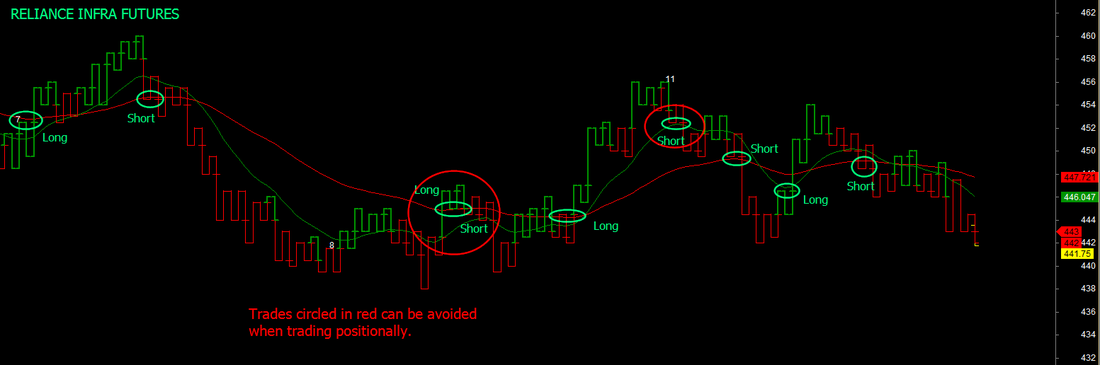 Normally, no, as the visual area of the chart does not allow charts in smaller time frames to show the bigger picture and these are cluttered with noise associated with ranging periods as well. At best traders look at higher and lower time frame charts. side by side. The picture changes, when one experiments with charts that are not dependent on time but just on price movements. Consider the convenience when intraday and positional trades are actually part of an overlapping trend. Exits and entries can then become precise and the two trading styles can overlap seamlessly. Check this unusual proprietary trading chart that uses our version of the Kagi method that is noise cancelling like Point and Figure and Renko, but visually shows opportunities for both intraday and positional trades, as the chart is capable of showing several days data in the same viewing range. Addition of moving averages provides resistance and support information, that obviates the need for any other indicator for trading. Traditional Kagi charts use closing prices and %age reversals or absolute reversal values. In this chart, the reversals are based on point and figure principles and so is the data. Our charts show all the information that a chart should - namely date and time, ability to enter buy and short signals, even on Kagi style charts and consequently the profit/loss. In the two charts shown, the slower moving average is a turning point for positional trades, while faster average suggests (but not neccessarily completely) additional trades on an intraday basis. This chart is made available as one of the trading options for traders who are part of our mentored trading programs. 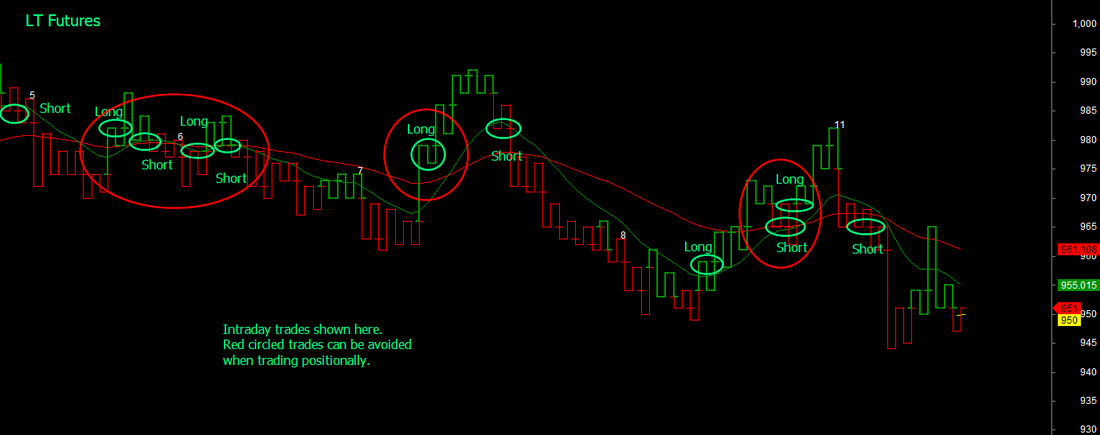 I had promised to show the impact of using a higher time frame chart during ranging periods. But instead of juggling between charts on different views, here is a method of showing the higher time frame chart on the time line of a lower time frame chart. The example is of 5 minute BankNifty futures shown along with a 1 minute chart of the same chart. Look at what happens on the higher time frame chart during ranging periods. Mini trends can be observed in the higher time frame that are not visible in the lower time frame. Now think of combining such charts so that you switch on and off higher time frame at will. Imagine the possibilities. Thats innovation at work at TradeWithMe. (click on any image to see a larger view). 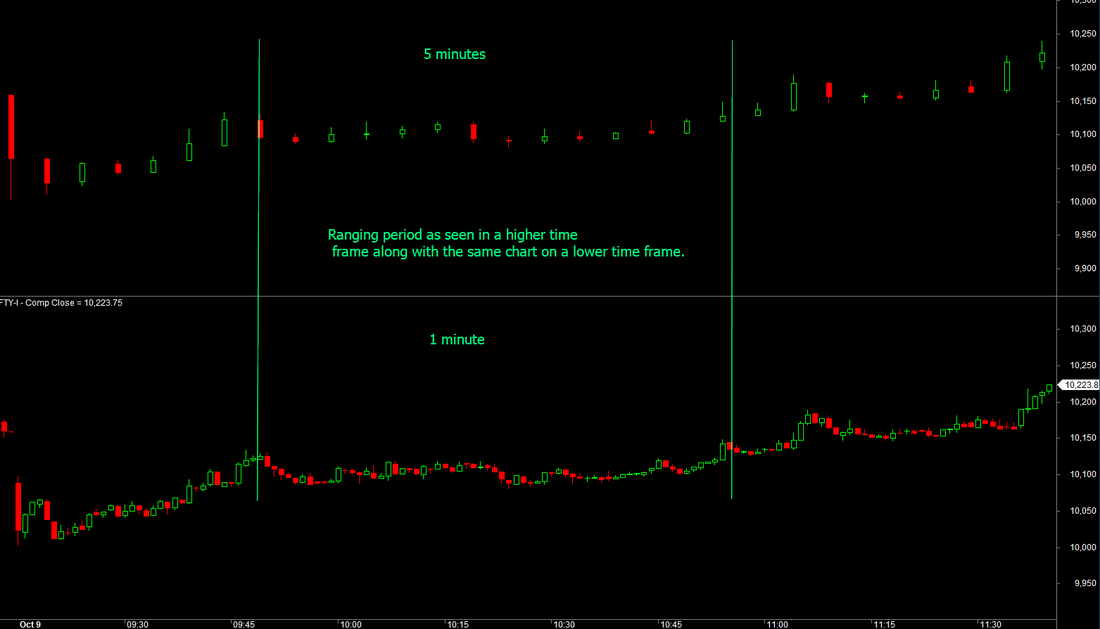
Now, if you thought that was neat, here is the combined chart... 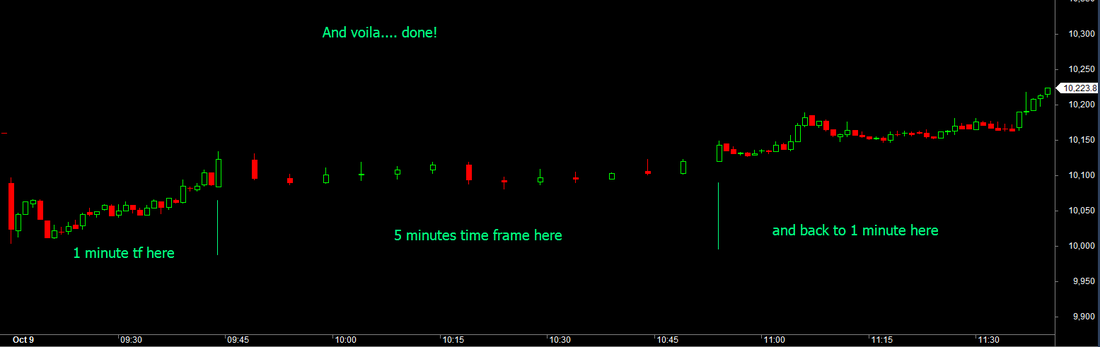
You can clearly now see a small ripple with two troughs, which then moves on to be part of the larger uptrend. This innovation may be small, but look at charts when in a trend. Its possible to stay stickily within the trend. See below the chart for October 9 2013 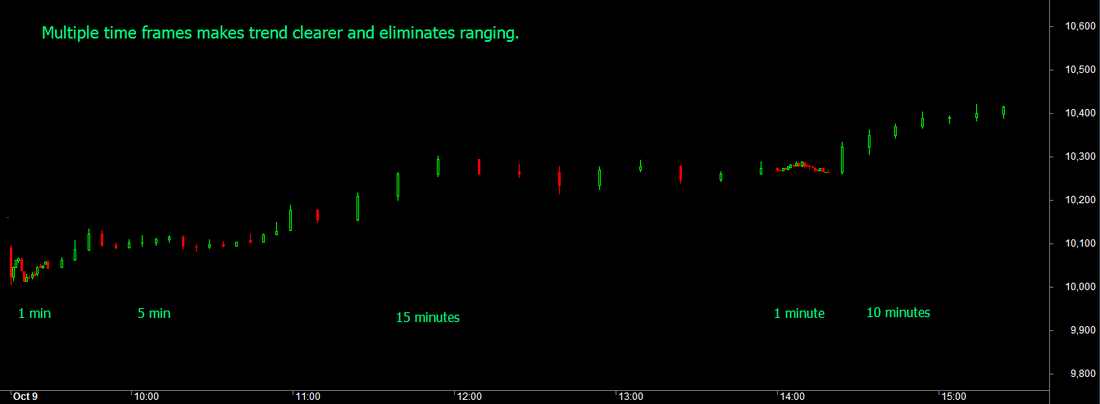
The only thing that matters in trading is that whats your bottom line.
Its not important that you have a great technical or fundamentals based algorithm, the fact of the matter, as we discussed a few posts ago is how often are you successful. There has to be consistency in your trading. You cannot work with a win ratio of 60% and then see 100% of your trades making losses for 2-3 days. Something is wrong, if that happens. You dont trade because you have mastered statistics. At the end of the day, do you feel happy that you traded right? (not just making money), but whether the method that you follow, is money making or a random flash in the pan. At TradeWithMe, our research has focused on why trades fail, and used that learning to improve. We were more than 150 points down on Nifty Positional trading in October till date, but in just one day today, we recovered all the losses as we realised what was not right. So what makes the difference? Its about verifying that losing trades failed your trading rule reasonably or not. If that can be evaluated objectively and you feel that you are in the 90%+ rating there, then your system is consistent. Otherwise, go back to the drawing board. Take our Fast reversal trading system for BankNifty. On October 8, we did some 17 trades with a net loss of 21 points or so. Thats pretty inefficient. On October 9, we just did 3 trades and made over 300 points, after analysing and fixing what didnt work on October 8. Its not about what went wrong, but what didnt work..... Think about this and re-invent your systems periodically. Once does go through this journey of life with experiences which betray trust.
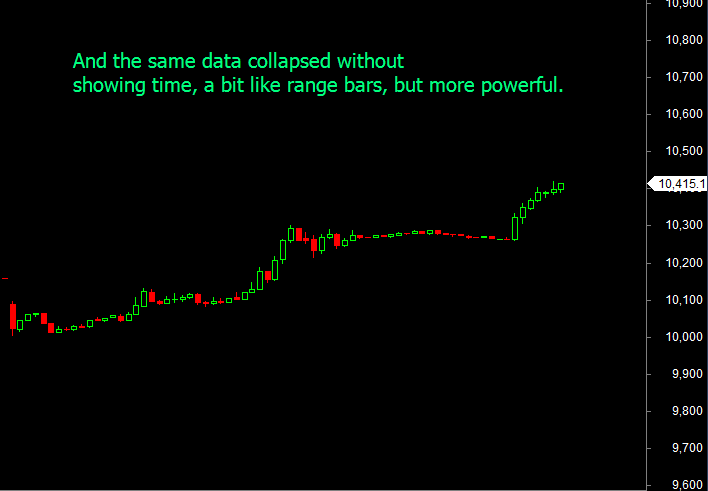
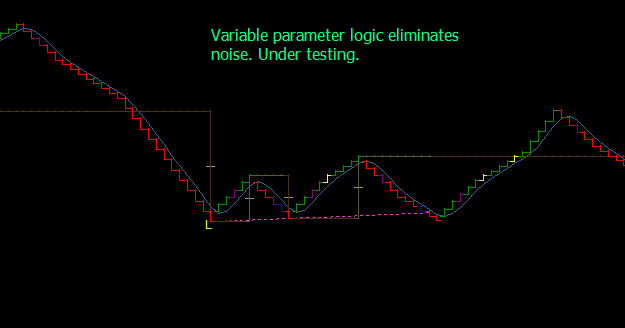
You see so much on TV and other media of situations, where people rip you off, intentionally and by design. In the business that I am, its providers like me who are seen to be the scammers. We have tried to be different by being ethical, professional and transparent. But lurking amongst the traders that are out there, are scammers of a different kind. Unprofessional and unethical. In the service offering that we offer here, we accept intentions of traders who want to join and trade with us or those that who arent satisfied where we refund their balance monies. For the first time in my professional experience, I have had someone who agrees to subscribe a service and plays a fraud by depositing an out of date cheque in my bank account, that ultimately reaches me after ten days and enjoys free service for 10 days. Its not the money that's important, but the fact that he refuses to respond to mails or acknowledge messages. Well, thats life, and a new learning from scam street anonymous! Technical analysts have used various methods to handle ranging periods. However, these dont work most of the time as a ranging period still appears as a range. Here are some different approaches to handling ranging. Range bars for example are a part solution where noisy movement within a given amplitude is suppressed. Here are some other options : 1 - Time based compression : In this approach, one would see ranging segments within an existing time frame by changing the time frame of that period from a current level to a higher period dynamically. What this means is that one would see a 5 minute chart having a user selectable period when that part of the chart is displayed with a higher time frame. What will happen is that the ranging period will drop or disappear in the overall context of the chart. I will show the conceptual implementation of the same in a few days. 2 - Amplitude based compression - beyond range bars - where variable amplitude thresholds are implemented based on the trend. So that trends stay sticky. What that means that if a chart shows a trend, the system will automatically start increasing the amplitude of the reversal threshold so that no mid trend whipsaws affect the trades. This is perhaps one of the best kept secrets of smart technical analysts, as it is not easy to implement such a scheme. 3 - Noise less charts - Point and figure, Renko and Kagi charts eliminate noise. Change the key threshold parameters in these charts to get the same impact of amplitude based compression. This is current part of TradeWithMe's cutting edge research, where initial experiments demonstrate very good potential. See samples of what is achieved. Same data - two different logic: 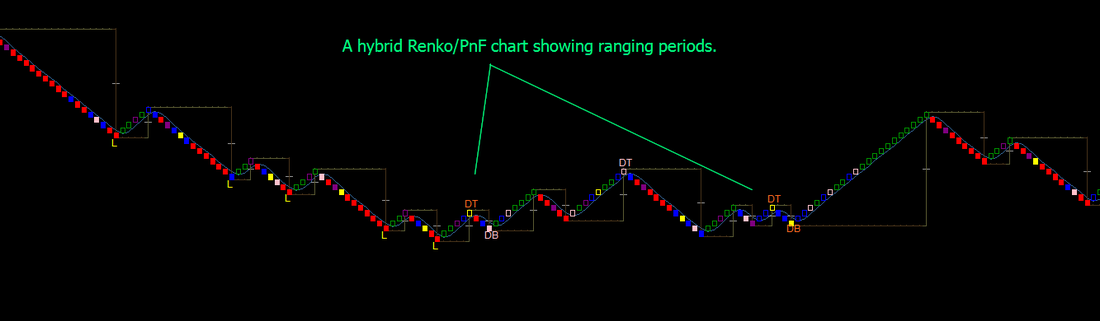
Much has been written by many writers and traders about ranging periods.
As a technical trader, I prefer to allow the trading system to manage such days so that trading remains non discretionary and enable automation. What are the ways to handle ranging ? These are some ideas: 1 - Stay away from the market - easiest and most prone to opportunity profit losses. 2 - Put a limit on stop loss loss limit for the day and exit trading for the day. 3 - Enable a well thought out strategy to play itself out. One example of that is to take trades initiated following a cross of a threshold. For example, if RSI or Stochastics does not cross 30/70 or 20/80, do not initiate a new trade. Option 3 is the most promising and can be used by both discretionary and non discretionary traders for consistent trading. The choice of threshold logic is wide open, and can include what the trader prefers and uses normally. A fundamental input, that may be used is to stay away from periods that include ranging before a market news event. Thats optional. A good idea to manage volatile markets is to trade more frequently than even intraday strategies. This is something which I call "Fast Reversal" where trend direction is estimated at every price move and a trade taken. It can result in amazing accuracy as our own tests on BankNifty, which is very volatile, have shown. Accuracy levels are usually in excess of 80% for a well configured approach. As usual, no indicators - price is king! 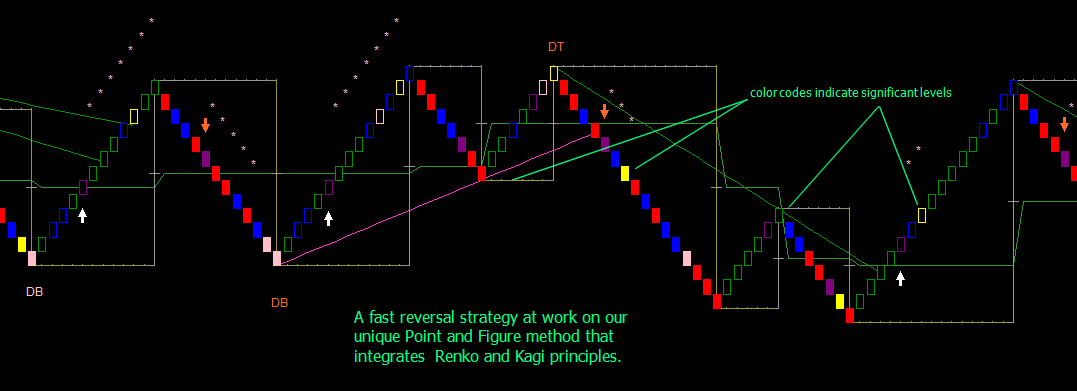
Its not good enough to just trade and make profits. There need to be several grains of consistency to ensure that trading generates a steady income, if that is one of the objectives for trading. In the last post, I wrote about trading accuracy, which reduces the effort to achieve a profit level. If our trading accuracy is 70% and each winning trade makes Rs 1000 and a losing trade loses 500, then in 10 trades our profits would be 7 x 1000 - 3 x 500 = 7000-1500 = 5500 or 55% of the maximum profit potential. If our trading accuracy is 50%, the same equation turns to give a profit of 5000-2500= 2500 or 25% of the profit potential. Now, if we want an income of Rs 50000 in a month and we traded at 70% accuracy and did 10 trades in each session, we would need approximately 10 sessions to achieve this objective. If however, our accuracy is 50%, we would need to traded 20 sessions to achieve the same results. i.e. for a 20% drop in trading accuracy, we have to trade 200% more to achieve the same results. That leads me to the next important consideration, that I have been focusing for the last 6-7 months. Consistency. Consistency means, how often you can reproduce the trading accuracy, day on day....If you could consistently generate a 70% accuracy, then you can trade your method and take your winnings home day on day and live happily ever after. In the real trading world, this is less easier said, than done. The issue is with the underlying assumptions of the trading system that you use. If it cannot handle trading situations consistently... i.e. with the same level of results accuracy, then we have a problem. It is my submission, that identifying winning trades has a strong relationship to the ability to recognize supports, resistances and trend breaks. These two factors need to be in some form part of any part of the technicals of a good trading system and when combined with a good risk management system is what will make a trader win consistent profits. At TradeWithMe, we have been using the Point and Figure method for over a year and innovated around that. The original point and figure method works well, in identifying new trends, but fails in ranging periods as do most trading methods. By using our own variation of the basic point and figure method and incorporating pattern recognition in a rudimentary form at this time, we are now able to trade with close to 100% accuracy and consistency well above 70%. A sample of what could be a good trading system is shown below to give ideas to the reader: 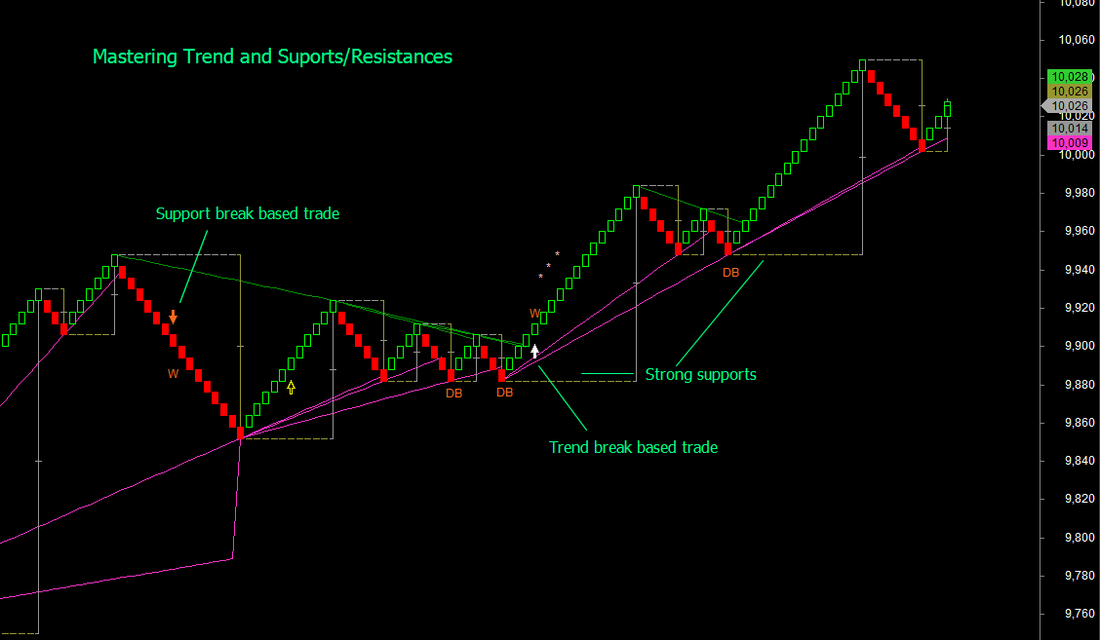 Several posts ago, I indicated that you can make money by coin tossing, which has a 50% success ratio by statistical probability. How does that happen? Smart traders always try to keep stop losses manageable and smaller than their profit targets. Effectively, your average win profit divided by average loss should be a factor of 1.5 or more, so that you make money. What this is means that for every losing trade your winning trades will make at least 1.5 times what you lost. On a win ratio of 0.5 or 50%, this will effectively translate to a win ratio of 1.25 in money terms across all trades.
(see the definitions below for the ratios) So the question is, what is good ? Just a great absolute profit ratio in real money or also the trade count win ratio. Here is where risk comes in again. Any trading system with a low win ratio will have a higher risk exposure, as the laws of statistics will work in the long run, but in the short run may expose you to significant draw down in a low trade count success ratio system versus one that has a high success ratio. Traders are sometimes impatient people. And that is their failing. By trying to search for trades in every market move, one is going to add up to loss overheads without any significant gain. And yours truly also admits having fallen for that sometimes. But here is what we have done now. We had a trade win ratio of 60% and a profit win ratio of better than 90%, but we were concerned with the draw downs on sharp market moves. So here are two things that we did, which others can also benefit from : - Tweaked the systems that we use to push up trade win ratio to better than 80%. Fewer trades, but successful. - Move to fixed reverse stop loss (if the trade does not make money, exit it at a predefined level). Important observation was that none of this reduced the overall net profit capabili Definitions : Trade win ratio or trade count win ratio = Winning trades / sum of winning and losing trades or all trades Profit win ratio = Profit from winning trades/ sum of profit and loss from all trades. |
AuthorAbnash Singh, Am a Trader helping small traders to realize their dreams. Archives
October 2017
Categories
All
|
 RSS Feed