• Home
    • Should I trade Futures and Options? >
      • Intraday or Positional?
    • Headlines
    • Site Map
  • Mentored training and trading
  • My Style - Blog
  • Nifty Trend
  • Data Services & Historical Data
  • Technical Analysis
    • Data Sources
    • Data Analysis Software
    • Chart Types
    • Support and Resistances
    • Chart Patterns
    • Candle Stick Patterns
    • Common Technical Indices - RSI, Stochastics, MACD, Bollinger Bands
    • Introduction to Chart Analysis
    • Build your trading strategy!
    • Trading Systems >
      • Trading Systems I : Moving Averages and Range Breakouts
      • Trading Systems II : Camarilla
      • Trading Systems III : Gann Levels - Some new thinking
      • Trading Systems IV : Murray Maths
      • Trading Systems V : Swing Trading
      • Trading Systems VI : A tango with Point and Figure charts
      • Trading Systems VII: Simulating your trades
      • Trading Systems VIII - Stop losses and targets
      • Trading Systems IX : Advanced techniques for simple and effective trading
      • Trading Systems X - Trading Without Indicators
      • Fibonnacci Levels trading
  • AFL Reference Library
  • EXTRAS
    • Learning
  • Contact Me
  TradeWithMe

MY STYLE - BLOG

Combining Point and Figure and Kagi methods

9/8/2014

3 Comments

 
I extensively use both Kagi and Point and Figure methods for my trading. The visual simplicity of Kagi has always been something that I like. However, the method doesnt provide the best way to detect changes in trend other than the usual Kagi reversal definition.

Its a known fact that Kagi,Renko and Point and Figure methods use the same underlying theory, but represent the data differently. By using Point and Figure theory, its easy to incorporate the 45 degree auto generated trend lines in Kagi charts. While Kagi charts already remove trend noise to a large extent, combining these with Point and Figure method of trend lines, produces amazingly simple and easy to interpret charts.

See the example of BankNifty point and figure and Kagi charts with PnF style trend lines in the attached screenshots. First is the Point and Figure chart and below it the same data in Kagi with trend lines.
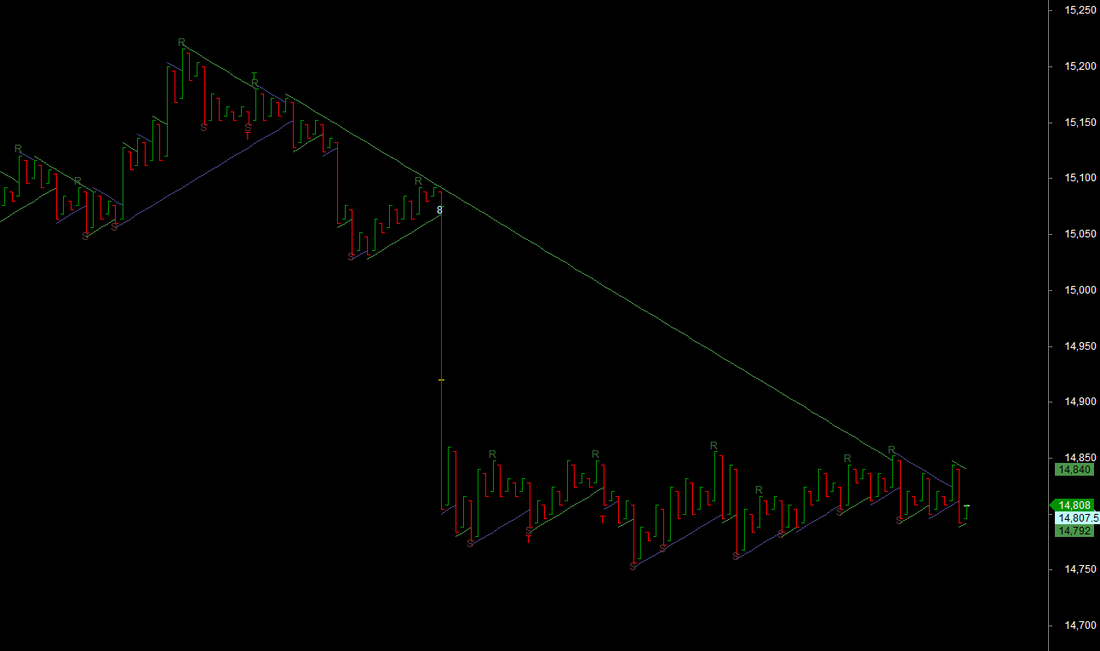
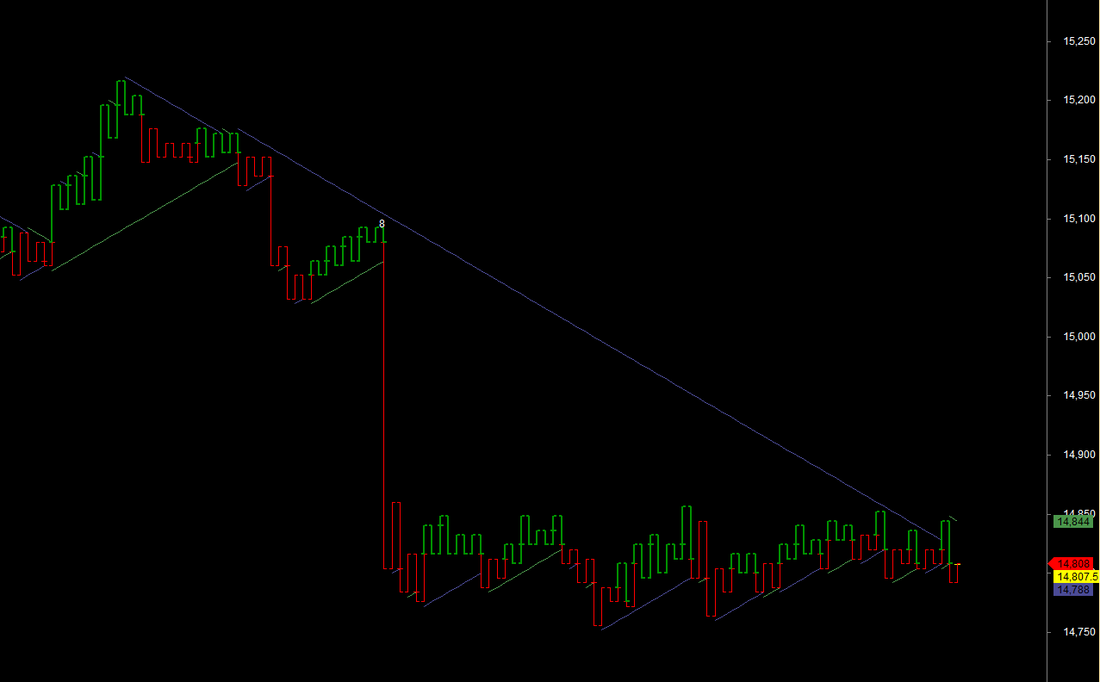

Picture
Picture
3 Comments
zain Jaffer
13/8/2014 01:26:15 pm

how do i get kagi & renko charts?

Reply
Abnash link
14/8/2014 02:46:30 am

These are not for public distribution and are provided to participants of the mentored trading program to become more effective traders.

Reply
Mayur Shah
24/2/2018 11:24:31 am

How can I participate in the Mentored Trading Program?

Reply


Leave a Reply.

    Author

    Abnash Singh, Am a Trader helping small traders to realize their dreams.

    Archives

    October 2017
    June 2017
    September 2016
    March 2016
    September 2015
    August 2015
    July 2015
    March 2015
    January 2015
    December 2014
    November 2014
    October 2014
    September 2014
    August 2014
    July 2014
    May 2014
    February 2014
    January 2014
    December 2013
    November 2013
    October 2013
    September 2013
    August 2013
    July 2013
    June 2013
    November 2012
    September 2012
    August 2012
    July 2012
    June 2012
    March 2012
    January 2012
    December 2011
    November 2011
    July 2011
    June 2011

    Categories

    All
    Customer Feedback
    Learning
    Objectives
    Risk Management
    Trading Methods

    RSS Feed

Powered by Create your own unique website with customizable templates.