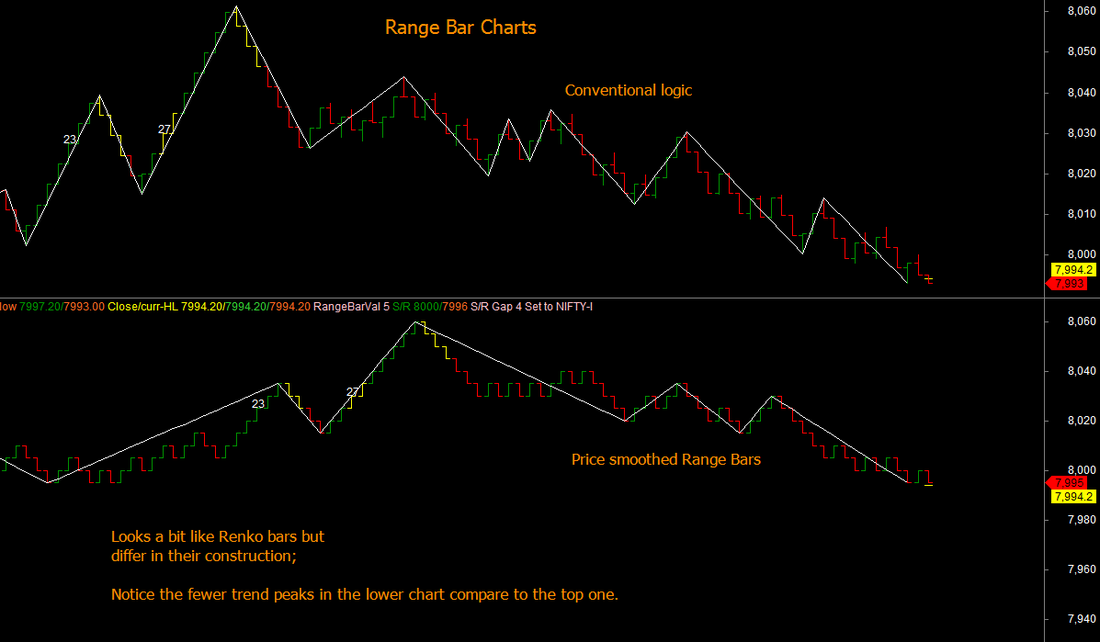
 As promised in the previous blog comment, here is one of TradeWithMe proprietary Range bar construction approach that combines Range and Renko methods to produce charts that show excellent trend characteristics that we are using for trading now.(click the chart to expand view)
Notice the lower noise in the chart in the lower pane above, that is smoother and shows trend without discontinuities. In the above charts, the Range bar construction logic that is used is : - Range bars are of fixed height, range bar value. - All bars close either at a high or low. - All new bars open at the edge of the previous range but may close at any level with the conditions given above. - Blank spaces are filled with empty or phantom bars shown as yellow bars in the charts above. - Price is smoothed using an approach similar to Renko or Point or figure. - A test will be done by removing phantom bars and also making the bars open 1 tick above or below the previous bar with a tick level being defined that can be used even with 1 minute bars data. Innovation at work!
7 Comments
Happy Diwali to all traders.
While Range bars are the newest kid on the block in trading without time charts, there is a lot of similarity between them and other conventional non time charts like Renko, Kagi and Point and figure charts. Range bars are constructed in a way that shows complete price movement tracing from close of the previous range bar to the high, low and the close of the corresponding time bar. The basis of movement is reversals that are more than the range bar unit. All the other three categories of charts Renko, Kagi and Point and Figure charts show discrete movements of price based on a unit similar to the Range Bar range, but with the additional price rounding of the highs and lows to the range unit (brick in Renko and box in Point and figure and reversal unit in Kagi). In fact if one rounds price in the range bars and looks at trend movement based on successive highs being at least one range unit higher (for uptrend) or lower (for downtrend), the result is presto!! a Renko chart :) ... And we know that Renko and Point and Figure and Kagi charts are basically the same charts with different visual representation. Kagi also adds the reversal unit to be a fixed value or a percentage. At TradeWithMe, we are working on a new version of Range bars that avoids some of the noise generated by the representation of the charts to include the closing value. The intermediate results are interesting. Stay tuned for more details here. Have a safe long weekend. |
AuthorAbnash Singh, Am a Trader helping small traders to realize their dreams. Archives
October 2017
Categories
All
|
 RSS Feed