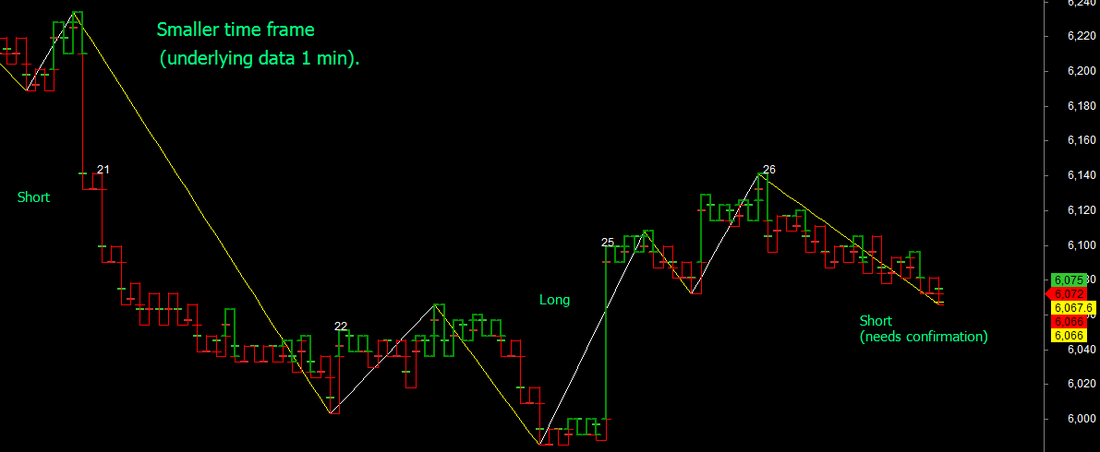
 Most trading approaches use the immediate price movement patterns for trading decisions. While thats a good approach, such approaches can be difficult to manage if one does not look at multiple timeframes (for time based) and coarser views for non time based charts. One of our powerful trading methods which has been making trading more efficient in the recent days is an application of Kagi chart principles along with core Renko/Point and figure methods, resulting in a completely new chart that is different from both PnF, Renko and Kagi, though it looks like the latter. Combined with a trend recognition method thats amazingly simple but effective, results in extreme noise cancellation and a significant reduction in ineffective trades. This results in charts that effectively get closer to mechanical trading. An example is shown in the chart along side, where we have plotted the trend for NIFTY futures for intraday and positional trades. And the best part is that the core data for these charts is 1 minute time frame data demonstrating again that intraday and positional trades can be initiated from the same charts. This effort is part of the ongoing effort to simpler and more effective trading at TradeWithMe. Notice that each vertical bar in the chart may hold a few minutes, few hours or few days of data seamlessly. The bar patterns themselves have a story to tell and can be used in conjunction with the trend line. There are no ranging zones on the charts as these have been effectively filtered out by the charting technology. There is also zero lag in pattern formation as the data source is 1 minute data and no price derivatives used. One may argue that you dont need 1 minute data, however, when event based price movements occur, these are invaluable. I dont yet have access to tick data to experiment, so cannot comment on how the charts woud perform with that data source. The addon sophistication of swing logic, fib retracements etc. are other tools that one can use here without worrying about chart responsiveness. (click images for a larger view) 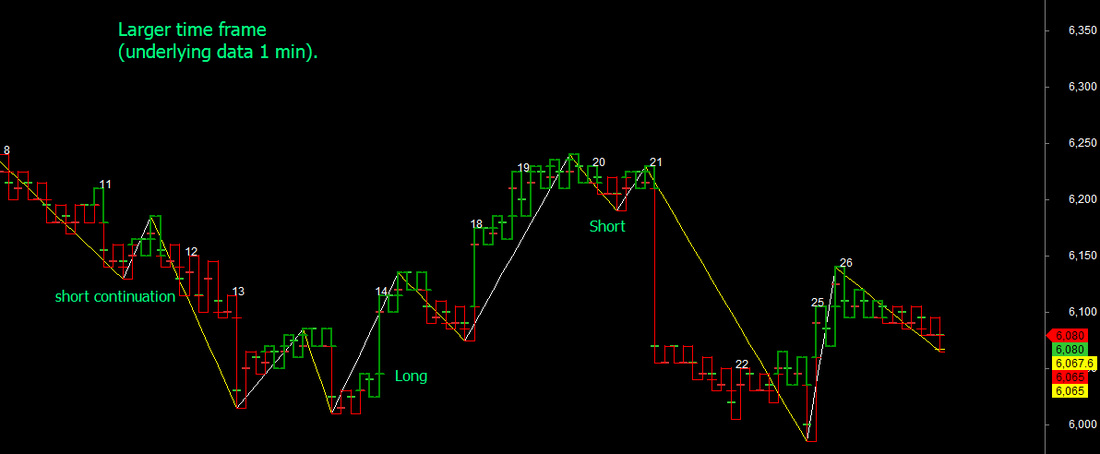
0 Comments
Want to know the subtle differences between different charting styles. You may already know most of it, but learning to using the right style that suits your trading profile and then sticking to it is important. Low time frame candle or bar charts. Unless secondary indicators are used, may lead to false trades. See the 1minute chart for BankNifty for most of the day on 11th November 2013 (click any image for a larger view): 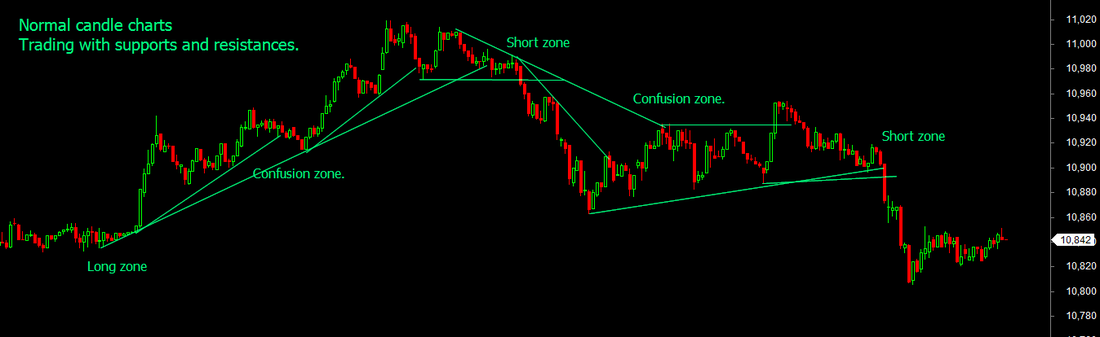 Well, you may say, dont use 1 minute charts and switch to 5 minutes to reduce the noise. Good, a solution, but may sometimes still generate false trades, but more reliable usually. 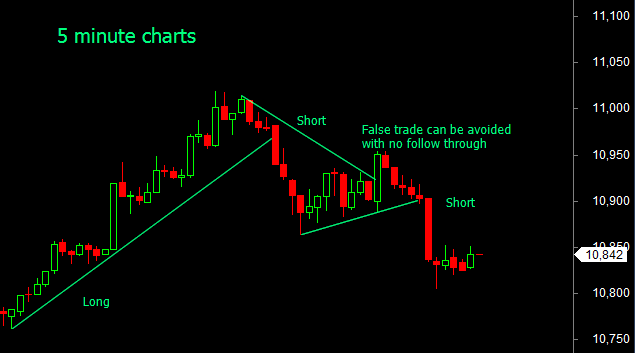 Look at the same chart in our version of the Point and Figure (PnF) method. Trend breaks and follow throughs are the usual rules to enter trades there. The trades seem to initiate late, as PnF is a breakout trading method. However, expert PnF traders can take early trades as shown in the second chart by drawing significant inner trend lines. 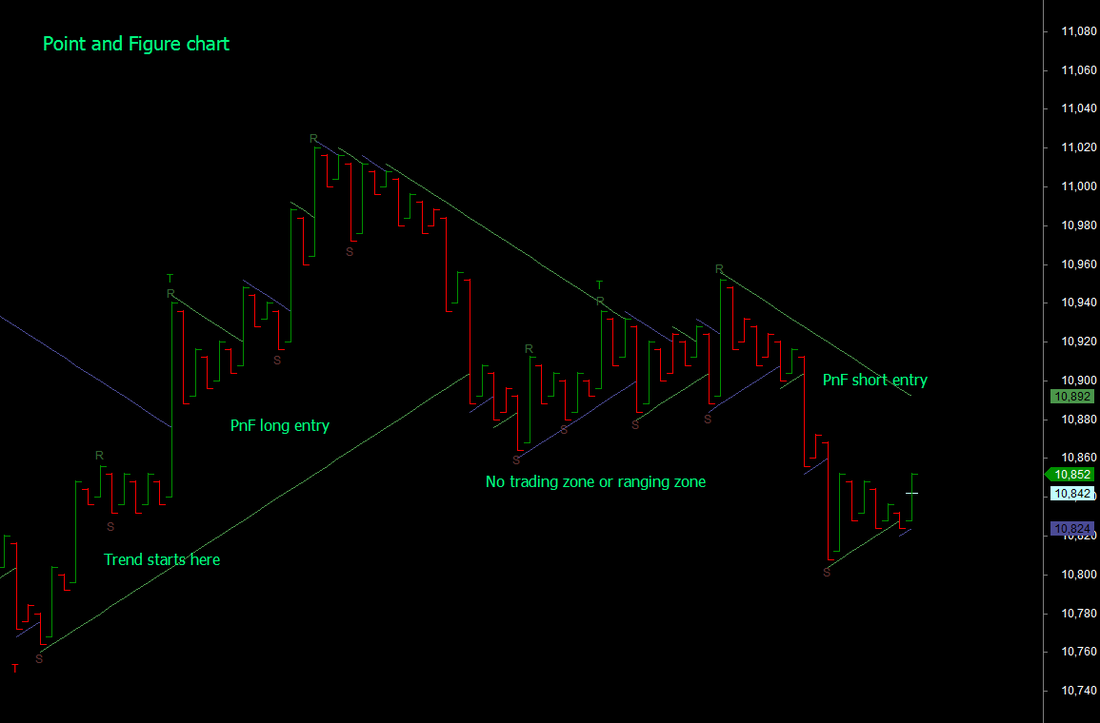 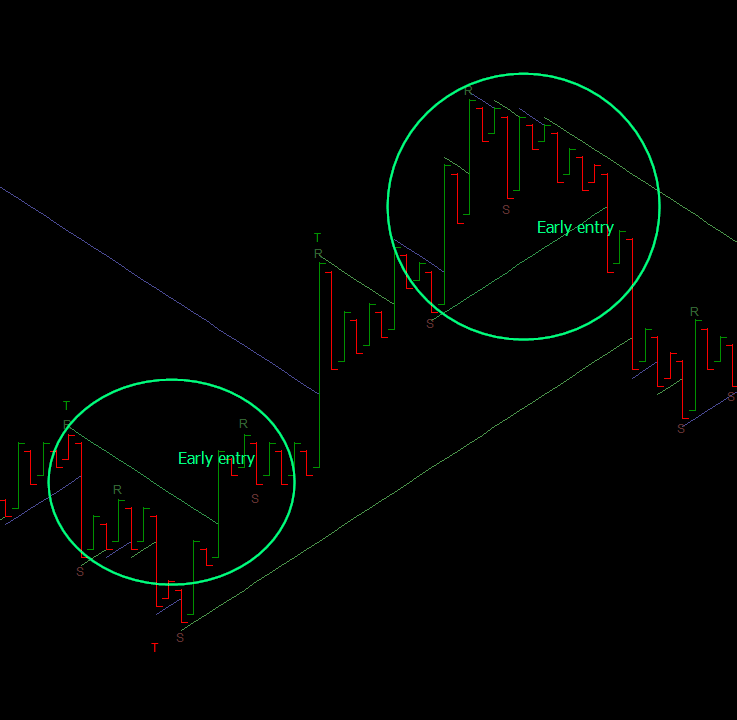 Looking at the same chart using the Renko method, where each move in the vertical columns of the PnF chart gets traced in zig zag 45 degree movements. This certainly allows early trade entries and using 1/2/3 or Elliot wave type of entries. A whole new world of possibilities opens up. 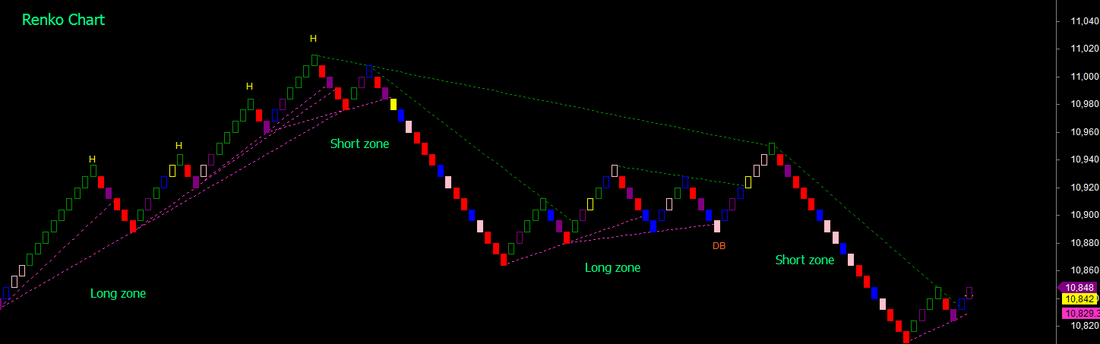 And finally, the Kagi style, where you look at only significant movements of price. See the same chart as above and the possible simpler trades and as indicated in the previous post combining Intraday and positional trades. 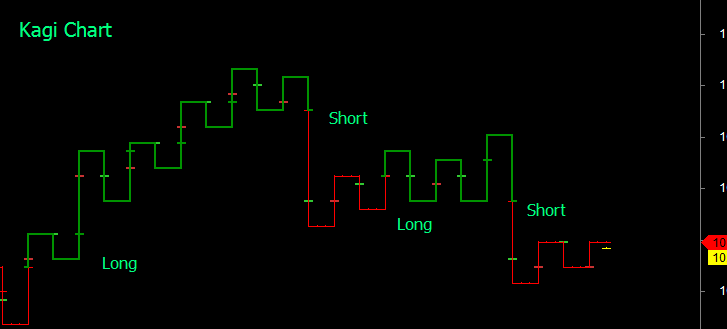 Want to multiply the possibilities for technical wizardy? Apply all your favorite indicators on any of these methods and explore what may happen. Personally, I only look at basic price movements and sometimes volume as everything else is dependent on them.
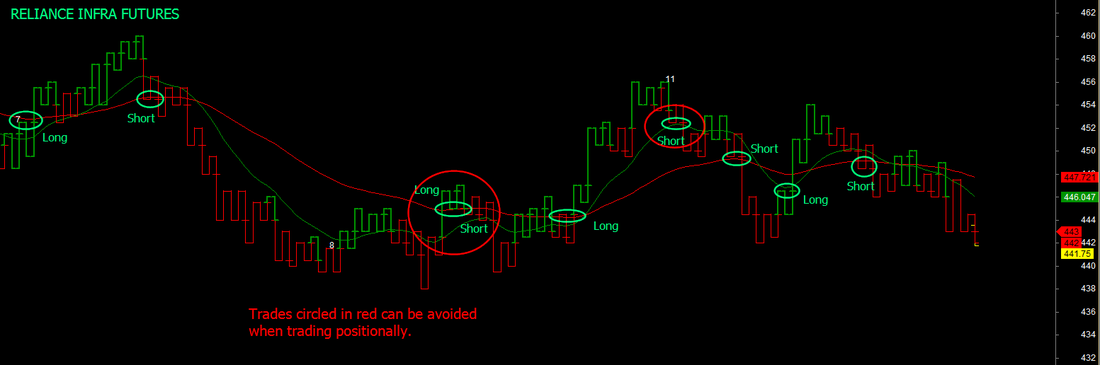 Normally, no, as the visual area of the chart does not allow charts in smaller time frames to show the bigger picture and these are cluttered with noise associated with ranging periods as well. At best traders look at higher and lower time frame charts. side by side. The picture changes, when one experiments with charts that are not dependent on time but just on price movements. Consider the convenience when intraday and positional trades are actually part of an overlapping trend. Exits and entries can then become precise and the two trading styles can overlap seamlessly. Check this unusual proprietary trading chart that uses our version of the Kagi method that is noise cancelling like Point and Figure and Renko, but visually shows opportunities for both intraday and positional trades, as the chart is capable of showing several days data in the same viewing range. Addition of moving averages provides resistance and support information, that obviates the need for any other indicator for trading. Traditional Kagi charts use closing prices and %age reversals or absolute reversal values. In this chart, the reversals are based on point and figure principles and so is the data. Our charts show all the information that a chart should - namely date and time, ability to enter buy and short signals, even on Kagi style charts and consequently the profit/loss. In the two charts shown, the slower moving average is a turning point for positional trades, while faster average suggests (but not neccessarily completely) additional trades on an intraday basis. This chart is made available as one of the trading options for traders who are part of our mentored trading programs. 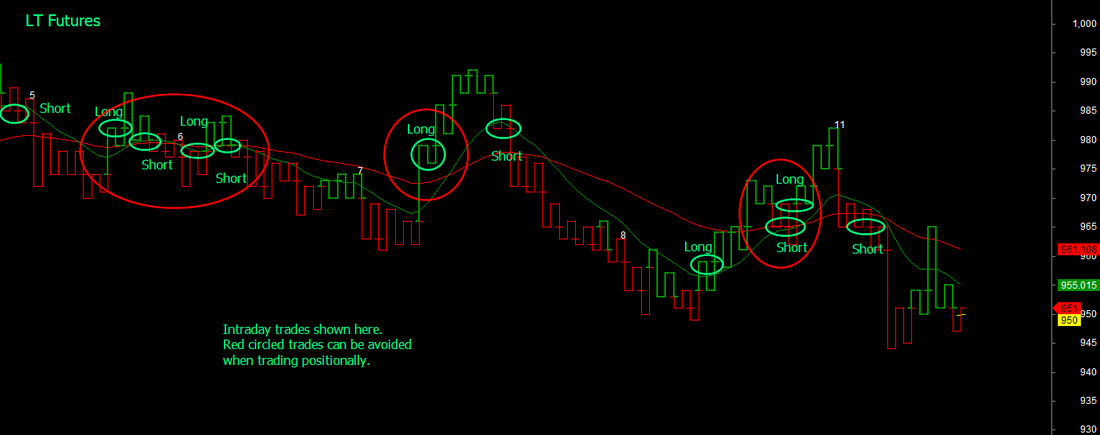 |
AuthorAbnash Singh, Am a Trader helping small traders to realize their dreams. Archives
October 2017
Categories
All
|
 RSS Feed