• Home
    • Should I trade Futures and Options? >
      • Intraday or Positional?
    • Services Offered & Pricing
    • Headlines
    • Site Map
  • Mentored training and trading
  • My Style - Blog
  • Nifty Trend
  • Data Services & Historical Data
    • Historical Data NSE
    • Historical Data MCX
    • Srini
  • Technical Analysis
    • Data Sources
    • Data Analysis Software
    • Chart Types
    • Support and Resistances
    • Chart Patterns
    • Candle Stick Patterns
    • Common Technical Indices - RSI, Stochastics, MACD, Bollinger Bands
    • Introduction to Chart Analysis
    • Build your trading strategy!
    • Trading Systems >
      • Trading Systems I : Moving Averages and Range Breakouts
      • Trading Systems II : Camarilla
      • Trading Systems III : Gann Levels - Some new thinking
      • Trading Systems IV : Murray Maths
      • Trading Systems V : Swing Trading
      • Trading Systems VI : A tango with Point and Figure charts
      • Trading Systems VII: Simulating your trades
      • Trading Systems VIII - Stop losses and targets
      • Trading Systems IX : Advanced techniques for simple and effective trading
      • Trading Systems X - Trading Without Indicators
      • Fibonnacci Levels trading
  • AFL Reference Library
  • Members Area
    • Learning
  • Contact Me
  TradeWithMe

MY STYLE - BLOG

Can you trade positional and intraday from the same chart?

12/11/2013

0 Comments

 
Picture


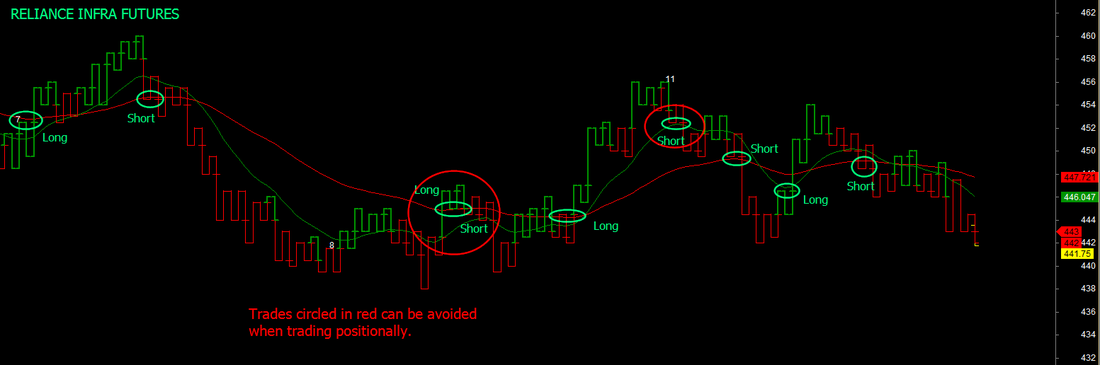
 Normally, no, as the visual area of the chart does not allow charts in smaller time frames to show the bigger picture and these are cluttered with noise associated with ranging periods as well.  At best traders look at higher and lower time frame charts. side by side. The picture changes, when one experiments with charts that are not dependent on time but just on price movements. Consider the convenience when intraday and positional trades are actually part of an overlapping trend. Exits and entries can then become precise and the two trading styles can overlap seamlessly.

Check this unusual proprietary trading chart that uses our version of the Kagi method that is noise cancelling like Point and Figure and Renko, but visually shows opportunities for both intraday and positional trades, as the chart is capable of showing several days data in the same viewing range. Addition of moving averages provides resistance and support information, that obviates the need for any other indicator for trading. Traditional Kagi charts use closing prices and %age reversals or absolute reversal values. In this chart, the reversals are based on point and figure principles and so is the data. Our charts show all the information that a chart should - namely date and time, ability to enter buy and short signals, even on Kagi style charts and consequently the profit/loss.

In the two charts shown, the slower moving average is a turning point for positional trades, while faster average suggests (but not neccessarily completely) additional trades on an intraday basis.

This chart is made available as one of the trading options for traders who are part of our mentored trading programs.
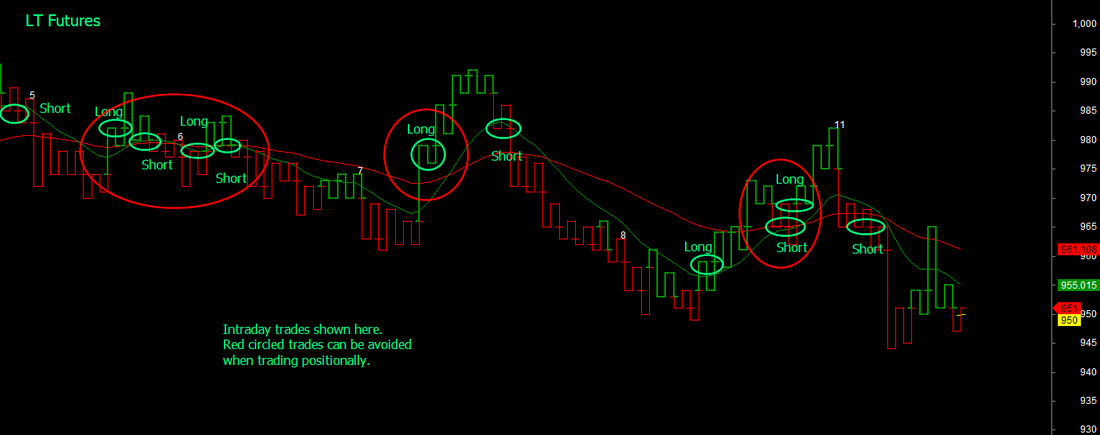
Picture
0 Comments


Leave a Reply.

    Author

    Abnash Singh, Am a Trader helping small traders to realize their dreams.

    Archives

    October 2017
    June 2017
    September 2016
    March 2016
    September 2015
    August 2015
    July 2015
    March 2015
    January 2015
    December 2014
    November 2014
    October 2014
    September 2014
    August 2014
    July 2014
    May 2014
    February 2014
    January 2014
    December 2013
    November 2013
    October 2013
    September 2013
    August 2013
    July 2013
    June 2013
    November 2012
    September 2012
    August 2012
    July 2012
    June 2012
    March 2012
    January 2012
    December 2011
    November 2011
    July 2011
    June 2011

    Categories

    All
    Customer Feedback
    Learning
    Objectives
    Risk Management
    Trading Methods

    RSS Feed

Want more information ? Get in touch with us through the contact form : (click here)