|
Want to know the subtle differences between different charting styles. You may already know most of it, but learning to using the right style that suits your trading profile and then sticking to it is important. Low time frame candle or bar charts. Unless secondary indicators are used, may lead to false trades. See the 1minute chart for BankNifty for most of the day on 11th November 2013 (click any image for a larger view): 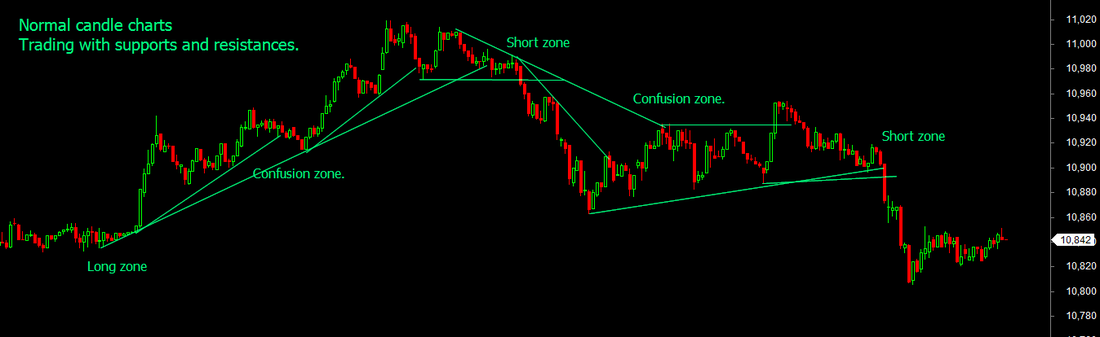 Well, you may say, dont use 1 minute charts and switch to 5 minutes to reduce the noise. Good, a solution, but may sometimes still generate false trades, but more reliable usually. 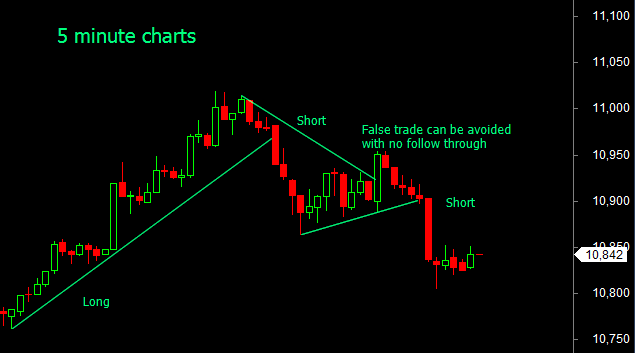 Look at the same chart in our version of the Point and Figure (PnF) method. Trend breaks and follow throughs are the usual rules to enter trades there. The trades seem to initiate late, as PnF is a breakout trading method. However, expert PnF traders can take early trades as shown in the second chart by drawing significant inner trend lines. 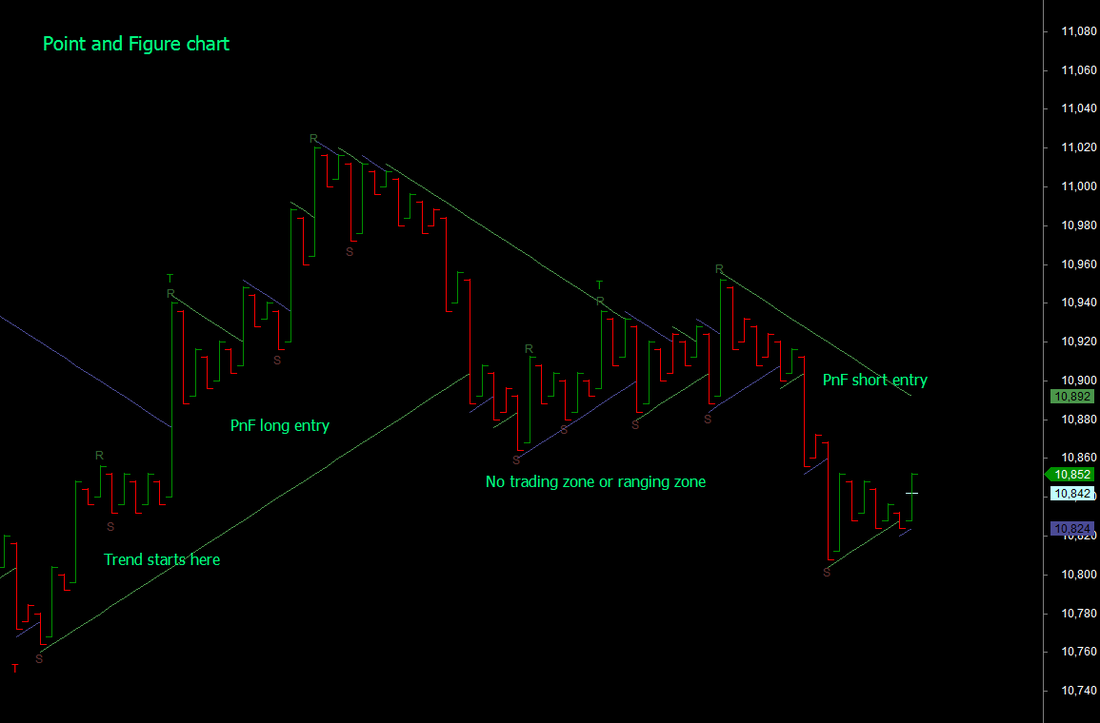 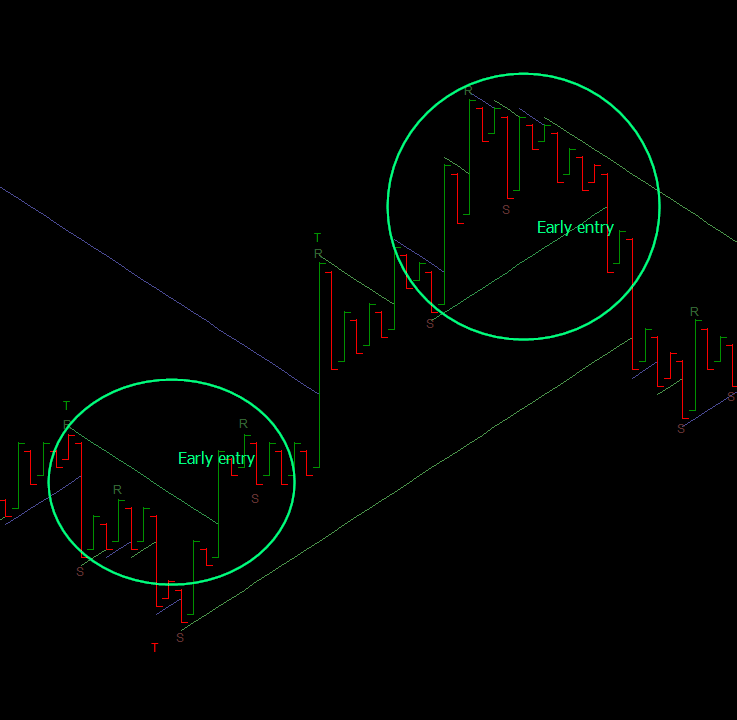 Looking at the same chart using the Renko method, where each move in the vertical columns of the PnF chart gets traced in zig zag 45 degree movements. This certainly allows early trade entries and using 1/2/3 or Elliot wave type of entries. A whole new world of possibilities opens up. 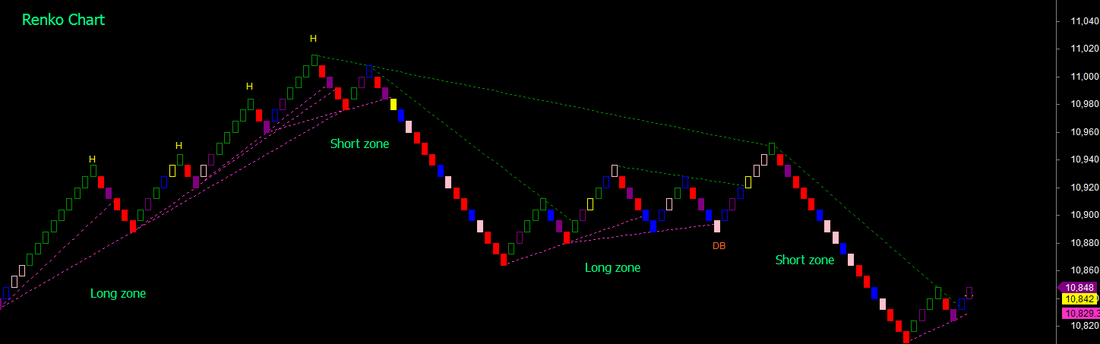 And finally, the Kagi style, where you look at only significant movements of price. See the same chart as above and the possible simpler trades and as indicated in the previous post combining Intraday and positional trades. 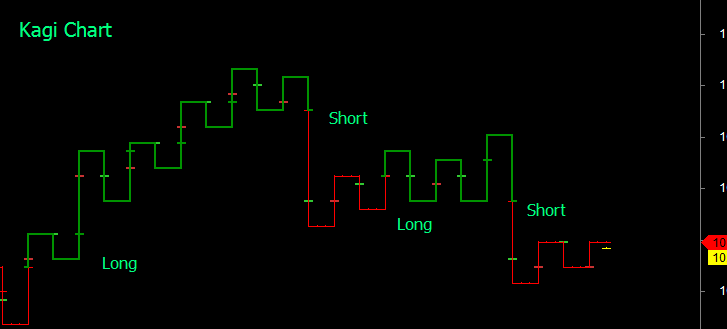 Want to multiply the possibilities for technical wizardy? Apply all your favorite indicators on any of these methods and explore what may happen. Personally, I only look at basic price movements and sometimes volume as everything else is dependent on them.
1 Comment
tRaDeR_B
3/1/2014 01:28:03 pm
impressive!!! Leave a Reply. |
AuthorAbnash Singh, Am a Trader helping small traders to realize their dreams. Archives
October 2017
Categories
All
|
 RSS Feed