|
One of the major challenges that any technical trader faces is the removal of noise from price charts as these obscure and camouflage the underlying trend to force trades that fail. The current methods to handle noise vary from basic to sophisticated, but still do not help significantly especially in ranging periods where a smaller period noise interferes with the trend patterns. An example of smaller period noise is swing patterns within a larger trend as shown below, which is a very common occurence in markets:  In the above examples the noise patterns are not exaggerated as they are in real markets. Some of the techniques that are used to remove noise are averaging price, using trend identifying methods like Heiken-Ashi and other similar approaches. Other alternatives are to use time-less charting methods like Point and Figure, Renko and Kagi or other proprietary methods. However, these methods do not handle lower order noise as shown above effectively, without significantly increasing trading risk. Another method to handle noise is to remove the spurious noisy patterns from the underlying data, before drawing the charts. This can lead to amazing clarity in the trends as is demonstrated in a noise removal technique used in a Kagi chart, as an example below in the two sets of images. The upper chart represents the same data but shows the underlying trend without any of the lower order noise. Another research innovation at TradeWithMe at work. 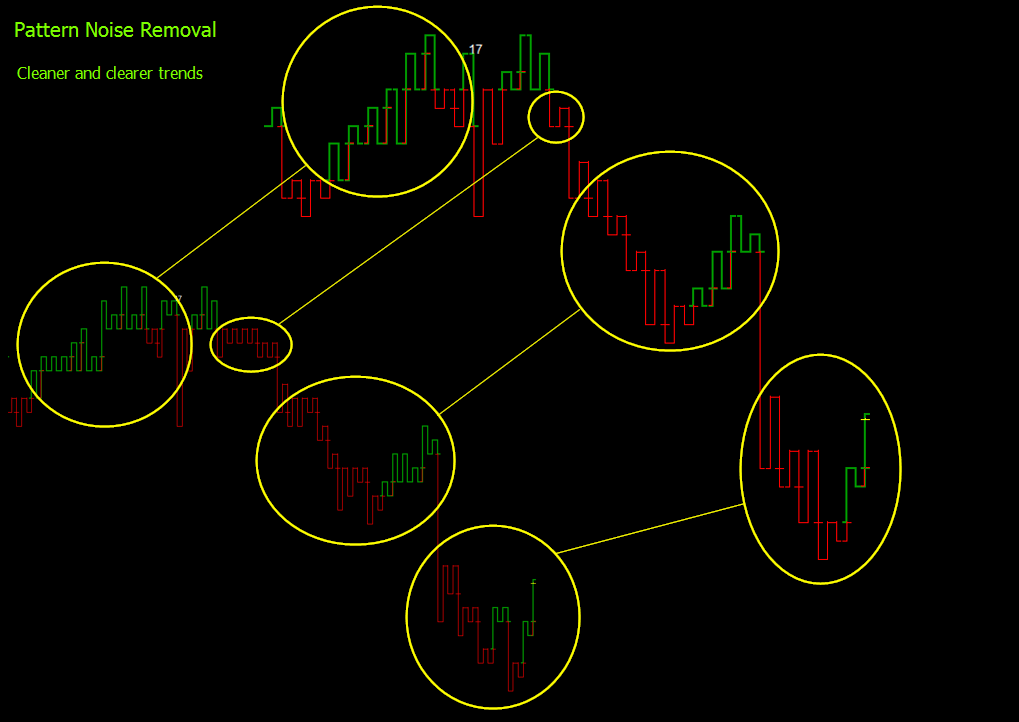 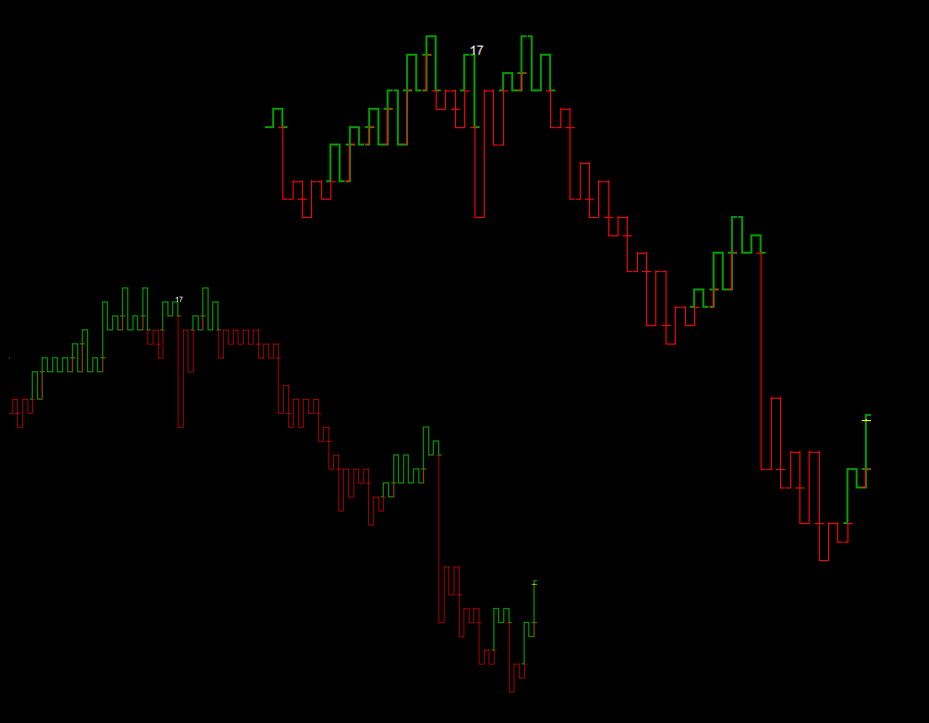
0 Comments
Some times you get pleasantly surprised with the most unusual comments in the trading social network. I was busy trading on January 15 and I get few comments during the day, which made me feel that the journey that I set out (helping traders meet their financial objectives) on is meeting its objectives. Here are the comments from a couple of traders, received on my messenger (names masked) which simply got me a smile and cheer in an otherwise bright day :) :
Quote Comment 1: dipxxz: i am not able to understand...i m watching a dream; is it real...sirji great sirji abnash: :) dipxxz: after joined with you sirji...i feel that mkt is not moving itself....you are operating....:) And a rejoinder from one of our traders : "bxxxxtrader : :)) i wonder what he'll say once he starts learning" Comment 2: belphexxxxxearch: ok belphexxxxxearch: long worked again sir :-) belphexxxxxearch: thnx abnash: Yes... abnash: :) belphexxxxxearch: u r a genius :-) Comment 3: Rxxxxxxa : Paisa vasool for us also :D (translation : 100% return on investment) Comment 4: (received on the blog comment - "Consistency In Trading", partly paraphrased for English corrections) Commodity Tips : I would want to thank for that efforts you've invested in this web page. I am hopeful that similar high-grade web posts are forthcoming in the future. Clothed in genuineness your imaginative writing skills has motivated me to achieve my own blog today. In fact your blogging is actually spreading its wings fast. You invent a sunny paradigm of it. Unquote I have never received such comments on my work, and I hope and wish that these and other traders who use the information on the website or tradewithme, get inspired and do well. As we come to the end of 2013, there are many who may be closing their trading accounts, giving up on the markets as a losing cause and there would be the wannabe youngsters or those who dont have any other alternatives to look at trading for a living.. Many of the traders who come and trade with me also give up and go away, but there are several who continue and make money. Now this post is not about whether they are doing right or wrong. Its the underlying assumption. Is trading profitable?
I have been in the markets as a serious trader for the last 3 years and make my living out of it. Its not that I have lost money at times, but on balance, this activity funds my living expenses, month on month for all of this period. What has made this possible? Here are some of the positive factors that anyone who wants to consider trading as a business proposition must consider - I am not going to talk about what they should do - there are enough soothsayers and advisors around who will tell you more about that :). I will summarise what I did : - Made trading my business with its objectives, targets and goals. - Defined a capital base that would be deployed with the assumption that it was 100% risk capital. - Identified (in this case developed) a trading system that gives a consistent win ratio. - Developed a structured trade entry and exit plan. - Developed a risk management plan suitable for my trading style. - Developed a money management plan for achieving the desired revenues. - Reviewed the progress month on month based on the business objectives and applied course corrections where-ever needed. Now you may wonder, that this may just be simple common sense. Well, adapt and use a similar plan, if you want trading to be your main source of livelihood. Good luck, Happy Christmas and a wonderful New Year ahead. And if you havent yet seen Robin Sharma's video in the last post, I urge you strongly to do so.  Check out details of this service which completes 6 months now.
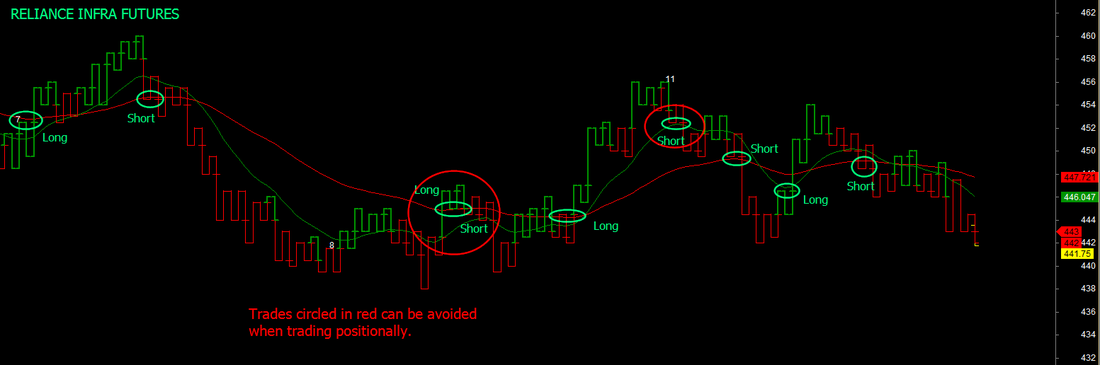
click this link. Read an interesting article by Niall Fuller on the traits of a crocodile and why we should adapt that into our trading strategy. 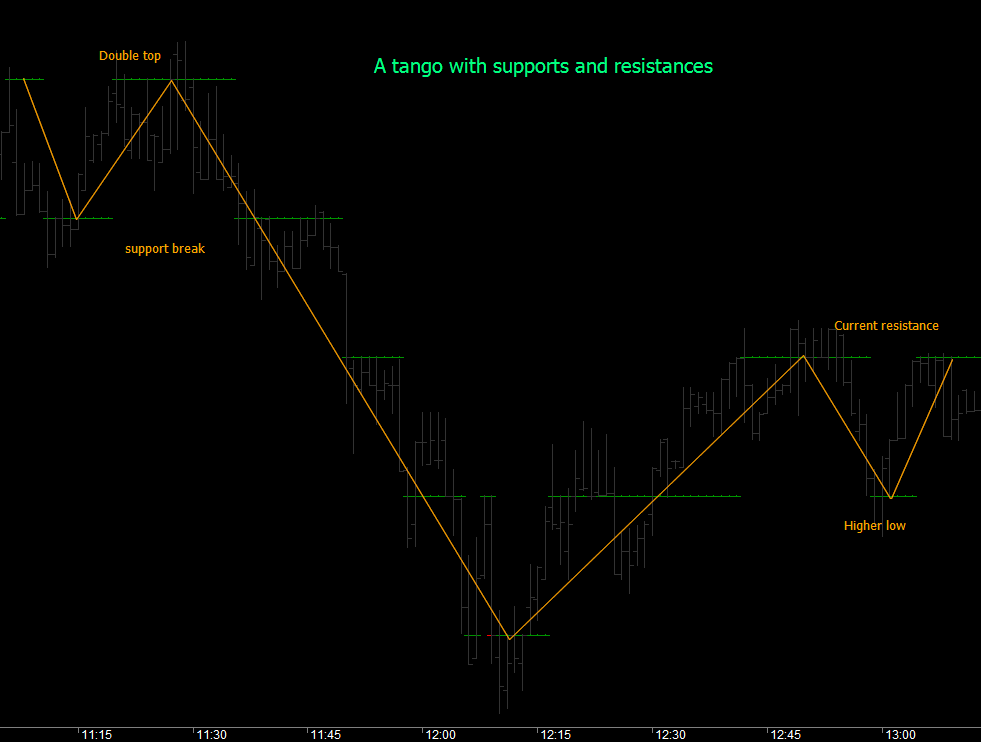 One simple way to trade is to identify supports and resistances and trade the trend based on them. An example of that is in the attached image. The way the supports and resistances are drawn as equidistant lines, immediately reveals the underlying trend eliminating noise. By using the supports and resistances as the basis to draw trend lines, rather than high-lows or close or averages, the trend becomes ordered and follows classical swing rules. The example on the left is drawn on 1 minute charts and the one below on 2.5 hour charts, showing how the approach is scalable. Just one of the innovations at work at TradeWithMe. 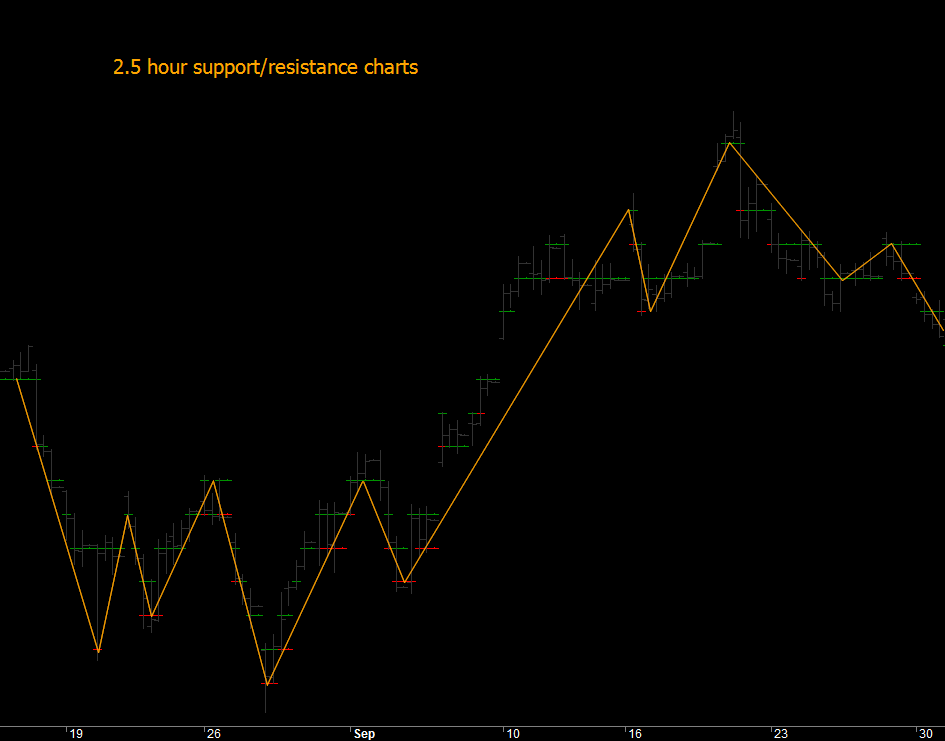 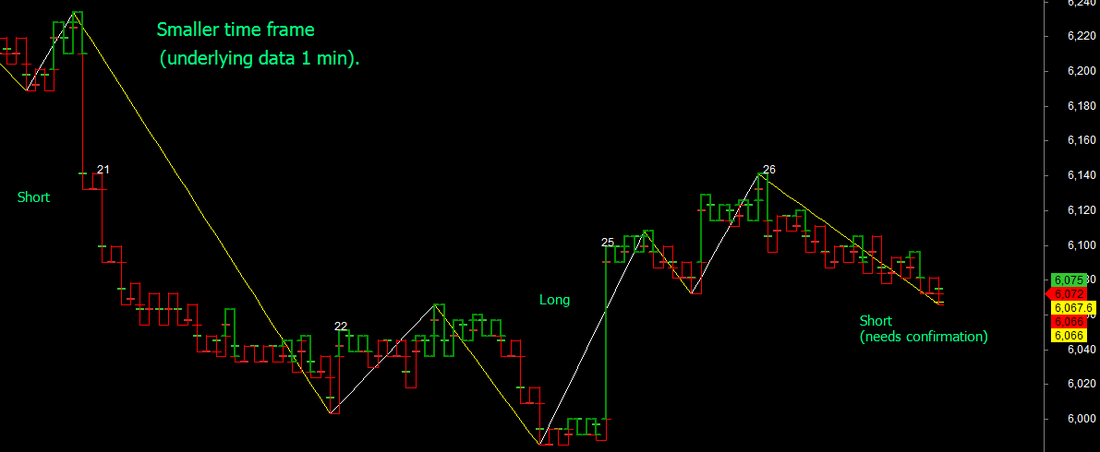 Most trading approaches use the immediate price movement patterns for trading decisions. While thats a good approach, such approaches can be difficult to manage if one does not look at multiple timeframes (for time based) and coarser views for non time based charts. One of our powerful trading methods which has been making trading more efficient in the recent days is an application of Kagi chart principles along with core Renko/Point and figure methods, resulting in a completely new chart that is different from both PnF, Renko and Kagi, though it looks like the latter. Combined with a trend recognition method thats amazingly simple but effective, results in extreme noise cancellation and a significant reduction in ineffective trades. This results in charts that effectively get closer to mechanical trading. An example is shown in the chart along side, where we have plotted the trend for NIFTY futures for intraday and positional trades. And the best part is that the core data for these charts is 1 minute time frame data demonstrating again that intraday and positional trades can be initiated from the same charts. This effort is part of the ongoing effort to simpler and more effective trading at TradeWithMe. Notice that each vertical bar in the chart may hold a few minutes, few hours or few days of data seamlessly. The bar patterns themselves have a story to tell and can be used in conjunction with the trend line. There are no ranging zones on the charts as these have been effectively filtered out by the charting technology. There is also zero lag in pattern formation as the data source is 1 minute data and no price derivatives used. One may argue that you dont need 1 minute data, however, when event based price movements occur, these are invaluable. I dont yet have access to tick data to experiment, so cannot comment on how the charts woud perform with that data source. The addon sophistication of swing logic, fib retracements etc. are other tools that one can use here without worrying about chart responsiveness. (click images for a larger view) 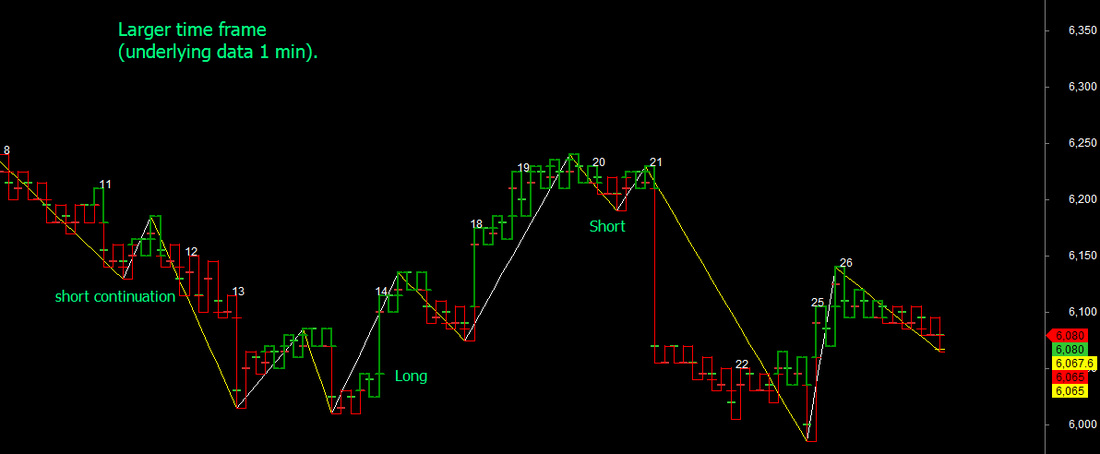 Want to know the subtle differences between different charting styles. You may already know most of it, but learning to using the right style that suits your trading profile and then sticking to it is important. Low time frame candle or bar charts. Unless secondary indicators are used, may lead to false trades. See the 1minute chart for BankNifty for most of the day on 11th November 2013 (click any image for a larger view): 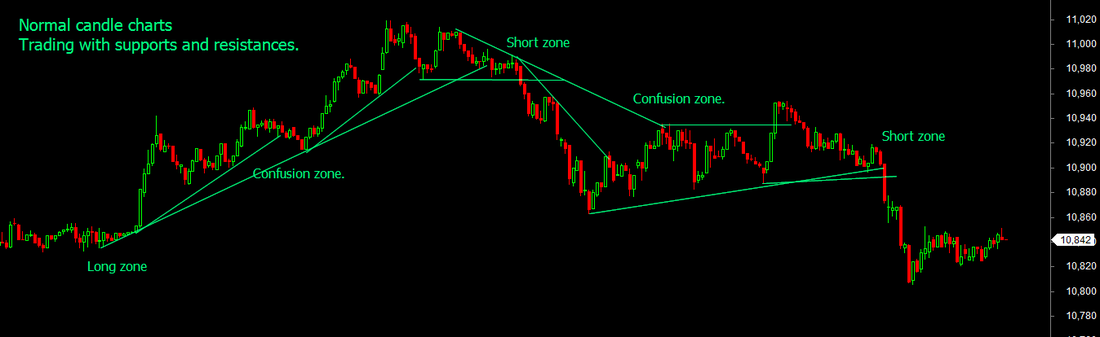 Well, you may say, dont use 1 minute charts and switch to 5 minutes to reduce the noise. Good, a solution, but may sometimes still generate false trades, but more reliable usually. 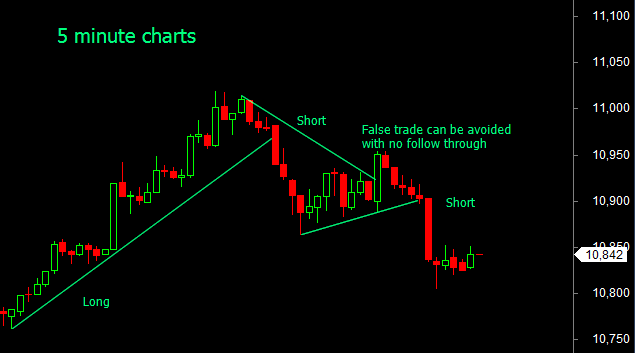 Look at the same chart in our version of the Point and Figure (PnF) method. Trend breaks and follow throughs are the usual rules to enter trades there. The trades seem to initiate late, as PnF is a breakout trading method. However, expert PnF traders can take early trades as shown in the second chart by drawing significant inner trend lines. 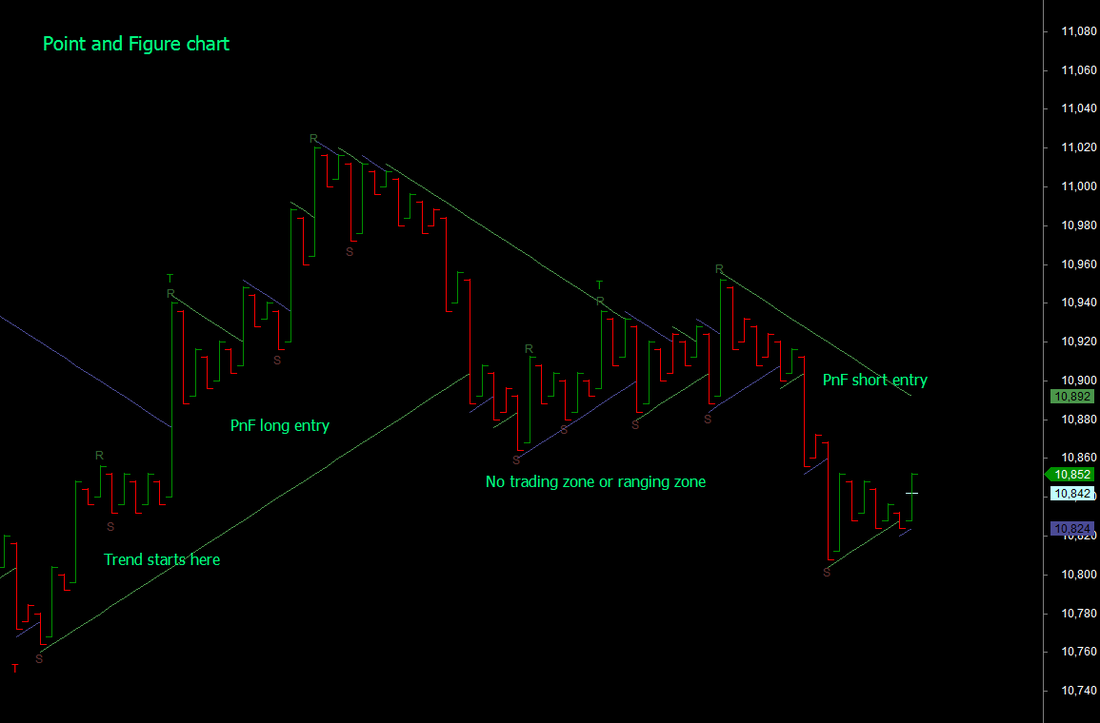 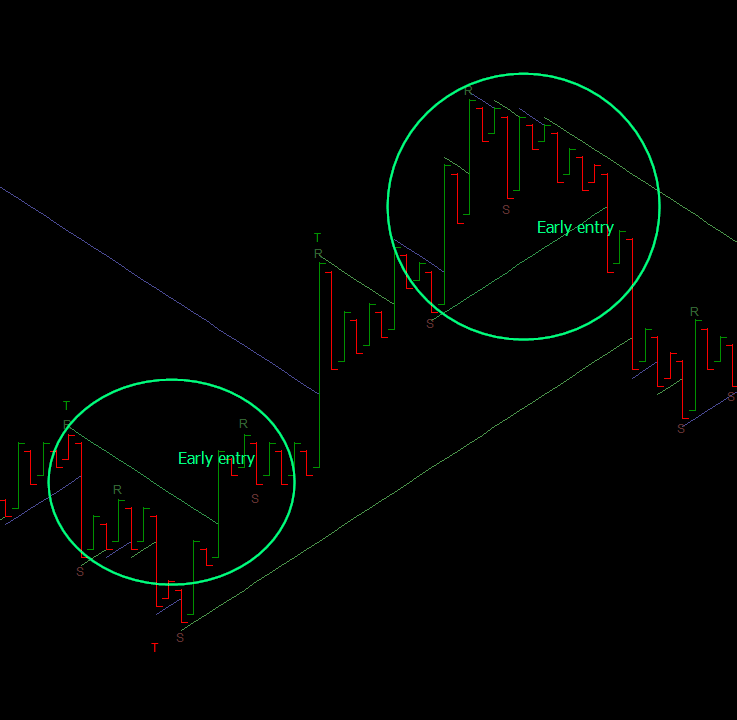 Looking at the same chart using the Renko method, where each move in the vertical columns of the PnF chart gets traced in zig zag 45 degree movements. This certainly allows early trade entries and using 1/2/3 or Elliot wave type of entries. A whole new world of possibilities opens up. 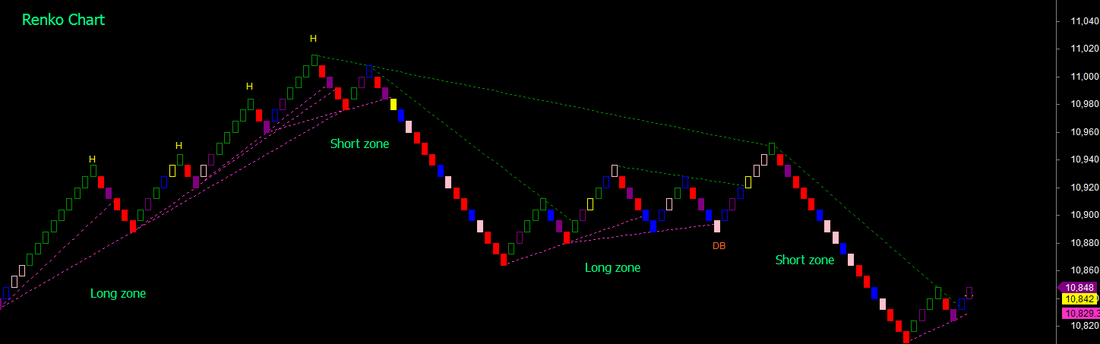 And finally, the Kagi style, where you look at only significant movements of price. See the same chart as above and the possible simpler trades and as indicated in the previous post combining Intraday and positional trades. 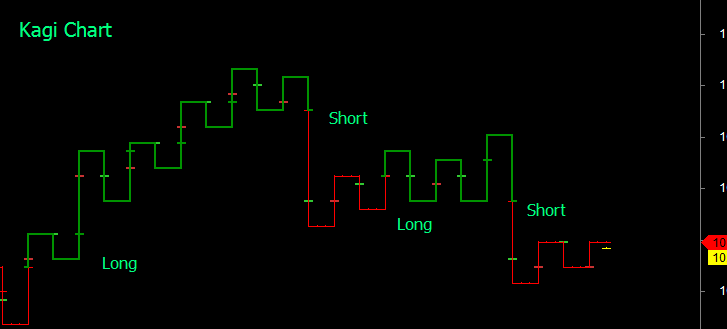 Want to multiply the possibilities for technical wizardy? Apply all your favorite indicators on any of these methods and explore what may happen. Personally, I only look at basic price movements and sometimes volume as everything else is dependent on them.
 Normally, no, as the visual area of the chart does not allow charts in smaller time frames to show the bigger picture and these are cluttered with noise associated with ranging periods as well. At best traders look at higher and lower time frame charts. side by side. The picture changes, when one experiments with charts that are not dependent on time but just on price movements. Consider the convenience when intraday and positional trades are actually part of an overlapping trend. Exits and entries can then become precise and the two trading styles can overlap seamlessly. Check this unusual proprietary trading chart that uses our version of the Kagi method that is noise cancelling like Point and Figure and Renko, but visually shows opportunities for both intraday and positional trades, as the chart is capable of showing several days data in the same viewing range. Addition of moving averages provides resistance and support information, that obviates the need for any other indicator for trading. Traditional Kagi charts use closing prices and %age reversals or absolute reversal values. In this chart, the reversals are based on point and figure principles and so is the data. Our charts show all the information that a chart should - namely date and time, ability to enter buy and short signals, even on Kagi style charts and consequently the profit/loss. In the two charts shown, the slower moving average is a turning point for positional trades, while faster average suggests (but not neccessarily completely) additional trades on an intraday basis. This chart is made available as one of the trading options for traders who are part of our mentored trading programs. 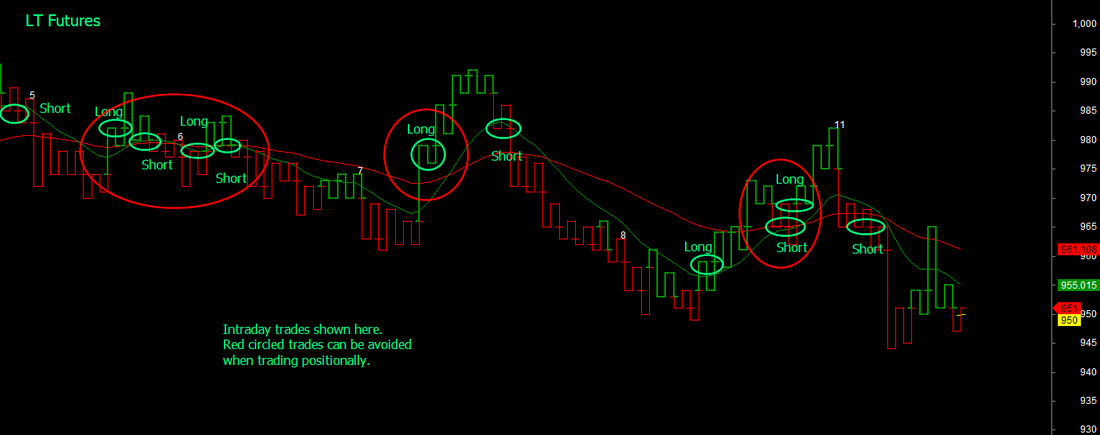 I had promised to show the impact of using a higher time frame chart during ranging periods. But instead of juggling between charts on different views, here is a method of showing the higher time frame chart on the time line of a lower time frame chart. The example is of 5 minute BankNifty futures shown along with a 1 minute chart of the same chart. Look at what happens on the higher time frame chart during ranging periods. Mini trends can be observed in the higher time frame that are not visible in the lower time frame. Now think of combining such charts so that you switch on and off higher time frame at will. Imagine the possibilities. Thats innovation at work at TradeWithMe. (click on any image to see a larger view). 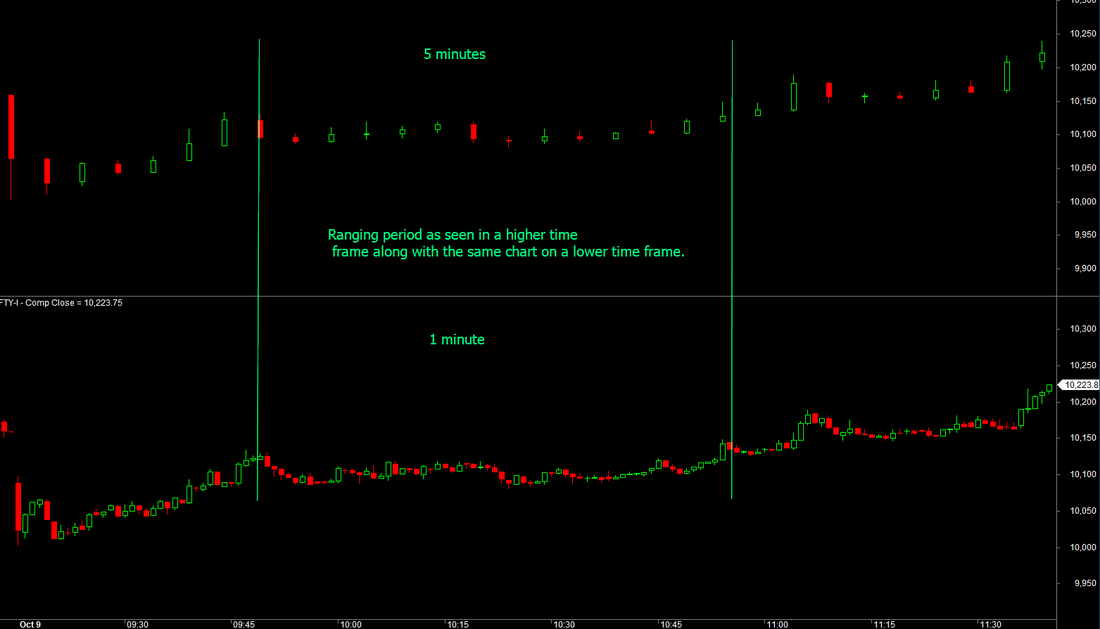
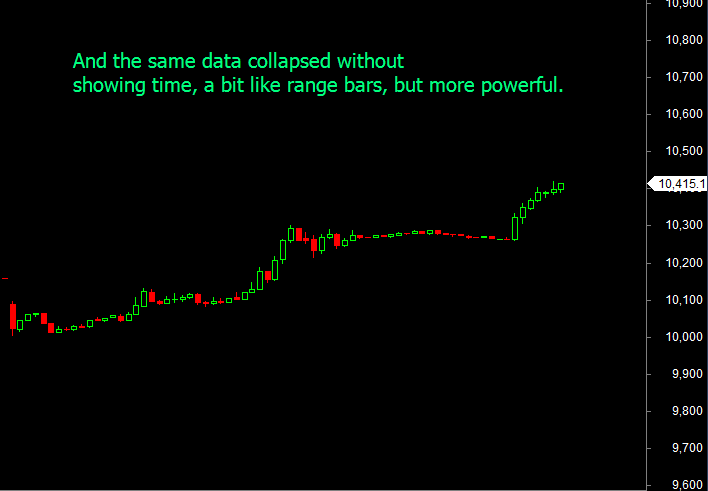
Now, if you thought that was neat, here is the combined chart... 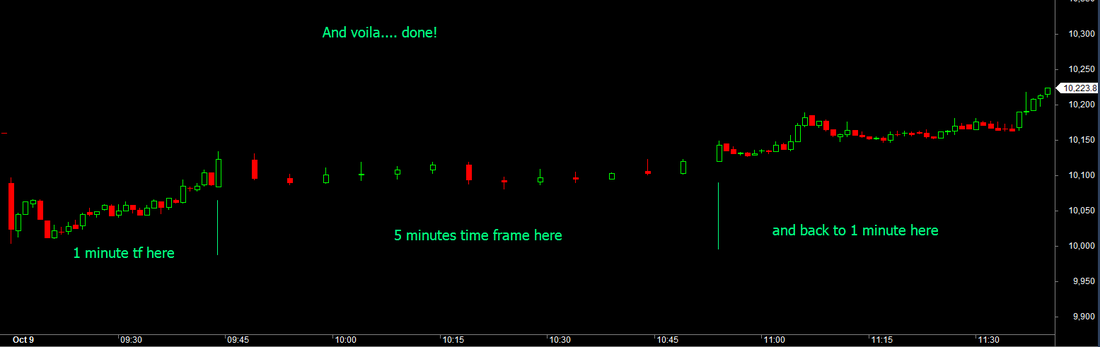
You can clearly now see a small ripple with two troughs, which then moves on to be part of the larger uptrend. This innovation may be small, but look at charts when in a trend. Its possible to stay stickily within the trend. See below the chart for October 9 2013 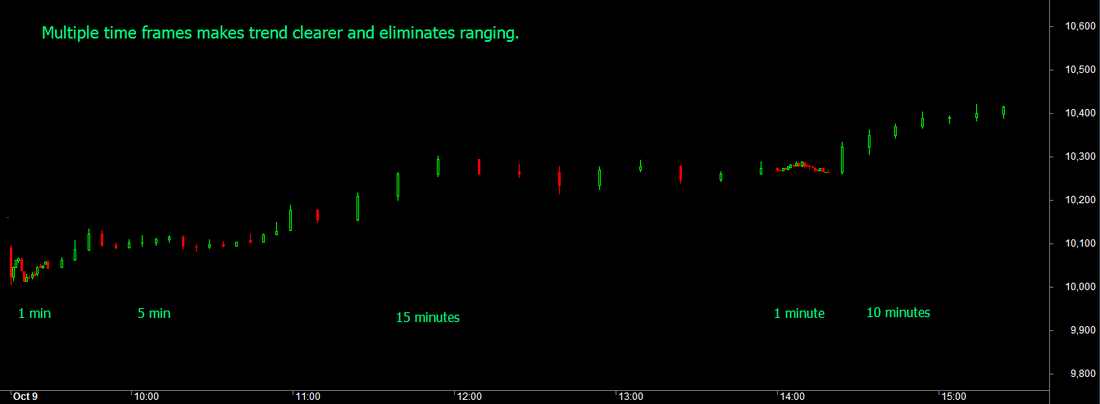
The only thing that matters in trading is that whats your bottom line.
Its not important that you have a great technical or fundamentals based algorithm, the fact of the matter, as we discussed a few posts ago is how often are you successful. There has to be consistency in your trading. You cannot work with a win ratio of 60% and then see 100% of your trades making losses for 2-3 days. Something is wrong, if that happens. You dont trade because you have mastered statistics. At the end of the day, do you feel happy that you traded right? (not just making money), but whether the method that you follow, is money making or a random flash in the pan. At TradeWithMe, our research has focused on why trades fail, and used that learning to improve. We were more than 150 points down on Nifty Positional trading in October till date, but in just one day today, we recovered all the losses as we realised what was not right. So what makes the difference? Its about verifying that losing trades failed your trading rule reasonably or not. If that can be evaluated objectively and you feel that you are in the 90%+ rating there, then your system is consistent. Otherwise, go back to the drawing board. Take our Fast reversal trading system for BankNifty. On October 8, we did some 17 trades with a net loss of 21 points or so. Thats pretty inefficient. On October 9, we just did 3 trades and made over 300 points, after analysing and fixing what didnt work on October 8. Its not about what went wrong, but what didnt work..... Think about this and re-invent your systems periodically. |
AuthorAbnash Singh, Am a Trader helping small traders to realize their dreams. Archives
October 2017
Categories
All
|
 RSS Feed