|
After we commenced the realtime signalling algo platform in place of the usual calls that were given through various manual methods, there has been a sharp learning curve of improvements with a bottom line of improved profit realisations for our customers with trading that is consistent and now scalable. We have been able to mix and match different trading styles and methods for different instruments in a flexible manner and now also showcasing our enhanced Point and Figure methodology on this platform. Traders are able to track trades easily as any change is highlighted with a distinct color change that is persistent for as long as 2 minutes. Furthermore backtest reports that give trade wise details are now provided to customers for as much as six months at present. Customers are also shown charts of each symbol at a prefixed comfortable frequency so that they can see what is happening to price trends. This is surely an evolving process and we are quite happy with the results of this new generation approach to trading. Several new technology firsts have been implemented to make the user experience enjoyable and engaging.(click any of the views for a larger image). 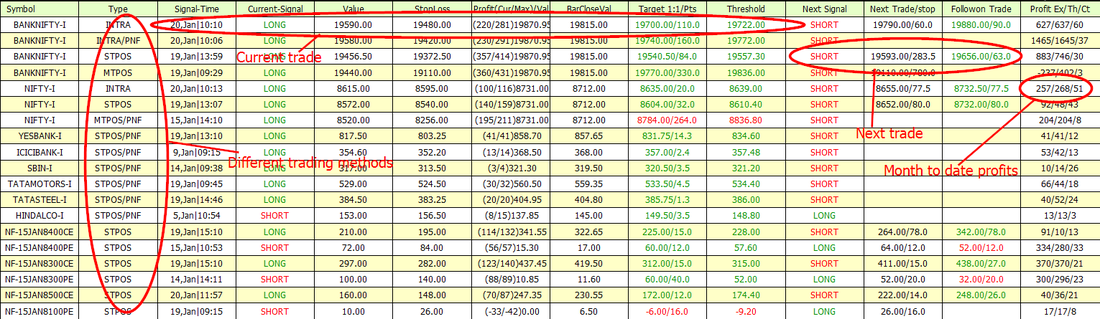 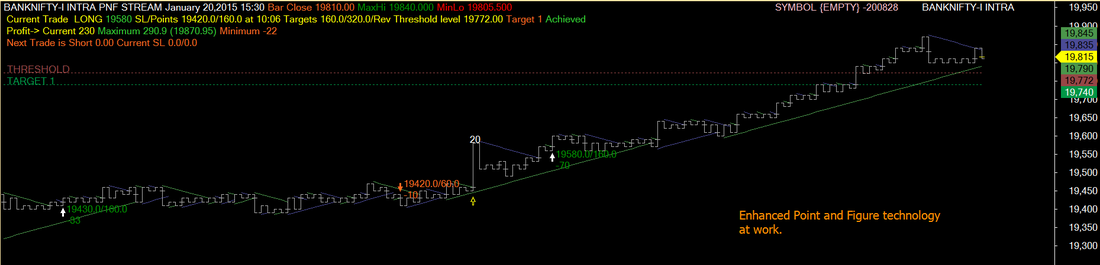
0 Comments
Here is the screen shot of the closing screen of our live trades LiveScreen broadcast. (click the image to get a larger view). You can see that 14 of 18 symbols on the screen had achieved their last most recent trades target. Thats a whopping 78% of them. The out of the money NIFTY 8100 PE is particularly interesting. Its made an 80% return on its investment in a single day. Live trading has been active for more than a week, where the LiveScreen is shared with our customers and they take the trades as shown on this screen. As there is absolutely no discretion involved, with signals being Algo generated along with the stoploss levels and exits, the system performance is extremely steady and consistent with a trade success of 44% by counts of winning trades and about 65% by winning trades value. This compares well with generalised algo performance anywhere. While traders can take trading decisions based on what is shown here, there is also a chart displayed which scrolls amongst all of the 19 odd symbols in the screen slowly for the main indices and faster for the rest. How is the live screen updated? All symbols get updated in real time with 4 background processes dedicated for this purpose so that the currency of data for any symbol is less than 5 seconds. Our customers now benefit with this new generation ultra modern style of signalling unlike the haphazard calls sent through various messengers and other texting services by others. Our customers trade without fear or emotion and can seamlessly scale up their trading based on unbiased performance that they achieve with this guidance chart. 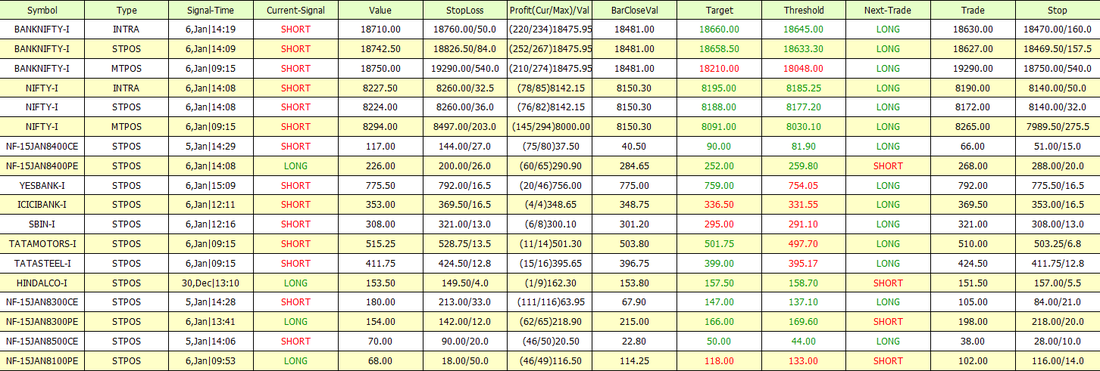 YOU CAN TRADE THE SIGNALS THAT WE BROADCAST PROFITABLY.. READ On.
Live signals generated from the automated analysis platform are now being generated for NIfty and BankNIfty Futures, Nifty Futures options and select stocks. All of the trade signals are known in advance several minutes before these trigger - which is the most unique feature of our approach and generate a success rate of 40-50% on a long term basis with excellent profit returns. All of these signals are being broadcase in high resolution low bandwidth format to make it possible to see the signals on any device - PC, laptop, IPAD and smart phones of all kinds. I believe that this innovation is a first and such an approach to sharing trades that can be traded in real time does not exist elsewhere, at least in the country. Trading signals are generated using a variety of trading logics to avoid logic fatigue that often plagues a single view of trading. Check this out by requesting a trial access.. Remember that none of our trading services are fee based services now. With Non discetionary or automated signals in place, the next logical step was to broadcast these signals to our customers and thats exactly what we have done. But unlike fuzzy low resolution, our trade screen broadcasts with trading signals for Nifty and BankNifty Futures are broadcast at high resolution with surprisingly low bandwidth requirements. Shown below is the original and broadcast screen on a PC. The broadcast which is currently under trials can be received on any PC, Mac or mobile device. The current system generates about 200 Nifty points and 700 BankNifty points after all costs with a trading success rate of 45-50% with zero intervention based on 6 months backtests. The original and broadcast screens are shown below. Anyone wanting a trial access to the broadcast is welcome to contact for access on any market day. The screens show intraday and positional trades for each index. Click on any image for a larger view. An interesting feature of these broadcasts is an automatic switch of the screen from Nifty to BankNifty every minute or so with the details of the current trade on the swapped out window shown on the current window that is showing the details of the other index. 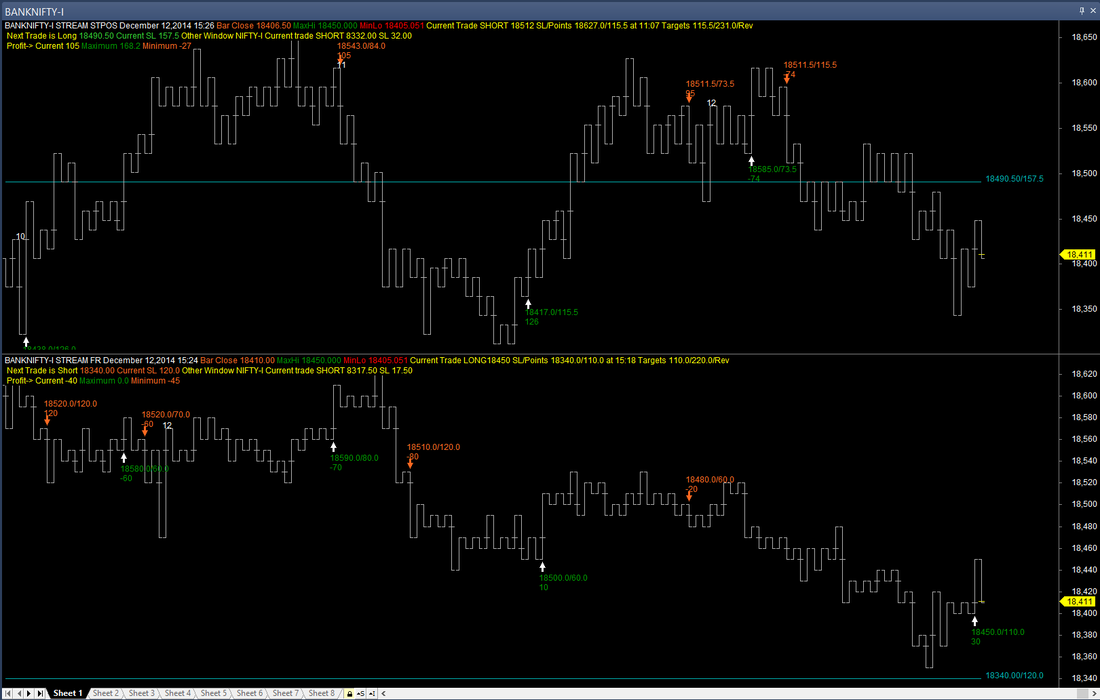 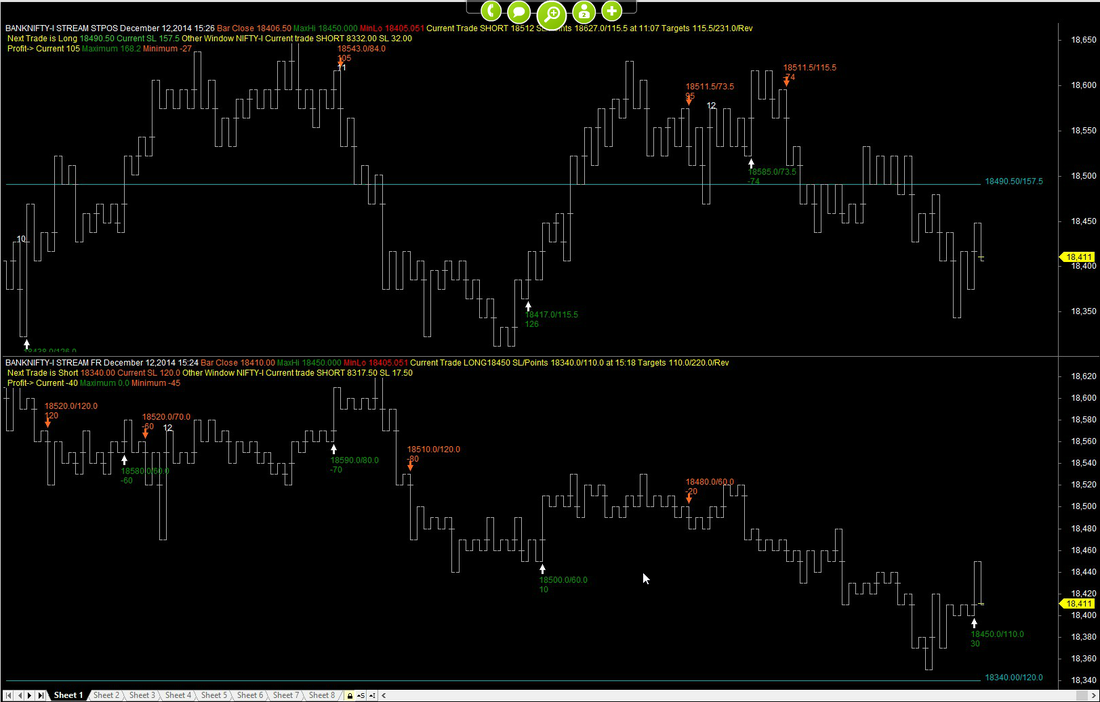 Finally after several years of working on discretionary trading, I have been able to design a system that is completely non discretionary. The motivation for this came from the deteriorating quality of trades on Nifty Futures which were caused by excess volatility where emotions tend to make systems go haywire. See todays trades on BankNifty futures through this system, the same one that we use also in mentoring and training traders through our mentored trading program.(click to expand picture). The Kagi representation is just one of the many ways that one can look at price movement and we chose that for this illustration. Otherwise, we could use time bars, point and figure, renko or anything else. The price movement basis is all that really matters. The trades seem to just flow with the trend. Backtests give success rates ranging from 45% to 70% based on the parameter selection. One revealing observation is that reversal trades - those that remain active till the price reverses trend are the most successful trades and beat risk based as well as fixed target trades in all time frames. One also needs to be sensitive to the natural frequency of the wave movement of each instrument to some extent as that affects the success ration. 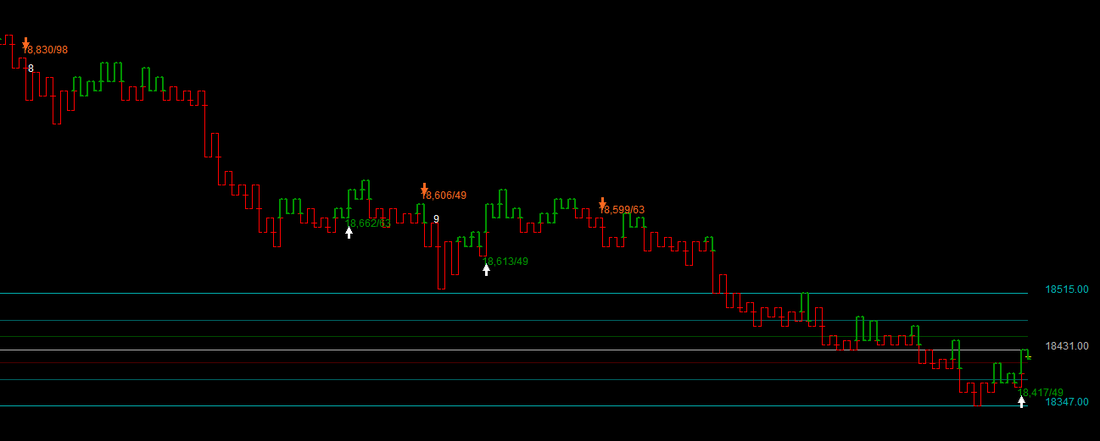 We have revamped the website with a new look. Hope you like it.
The Data Archives have also been promoted to their own top level menu. Nifty Futures trading has been overhauled to take care of the volatility with amazingly good results. Watch the performance page in the coming days. 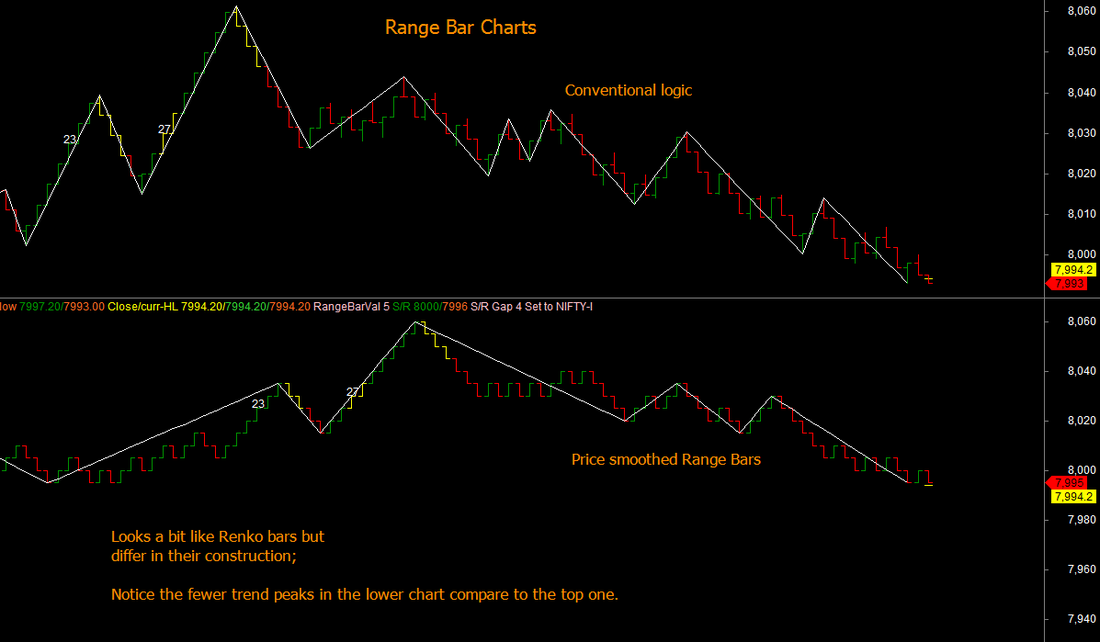 As promised in the previous blog comment, here is one of TradeWithMe proprietary Range bar construction approach that combines Range and Renko methods to produce charts that show excellent trend characteristics that we are using for trading now.(click the chart to expand view)
Notice the lower noise in the chart in the lower pane above, that is smoother and shows trend without discontinuities. In the above charts, the Range bar construction logic that is used is : - Range bars are of fixed height, range bar value. - All bars close either at a high or low. - All new bars open at the edge of the previous range but may close at any level with the conditions given above. - Blank spaces are filled with empty or phantom bars shown as yellow bars in the charts above. - Price is smoothed using an approach similar to Renko or Point or figure. - A test will be done by removing phantom bars and also making the bars open 1 tick above or below the previous bar with a tick level being defined that can be used even with 1 minute bars data. Innovation at work! Happy Diwali to all traders.
While Range bars are the newest kid on the block in trading without time charts, there is a lot of similarity between them and other conventional non time charts like Renko, Kagi and Point and figure charts. Range bars are constructed in a way that shows complete price movement tracing from close of the previous range bar to the high, low and the close of the corresponding time bar. The basis of movement is reversals that are more than the range bar unit. All the other three categories of charts Renko, Kagi and Point and Figure charts show discrete movements of price based on a unit similar to the Range Bar range, but with the additional price rounding of the highs and lows to the range unit (brick in Renko and box in Point and figure and reversal unit in Kagi). In fact if one rounds price in the range bars and looks at trend movement based on successive highs being at least one range unit higher (for uptrend) or lower (for downtrend), the result is presto!! a Renko chart :) ... And we know that Renko and Point and Figure and Kagi charts are basically the same charts with different visual representation. Kagi also adds the reversal unit to be a fixed value or a percentage. At TradeWithMe, we are working on a new version of Range bars that avoids some of the noise generated by the representation of the charts to include the closing value. The intermediate results are interesting. Stay tuned for more details here. Have a safe long weekend. In view of our performance on trading our account, the calls services are no longer chargeable services. Those who want to access these may do by making a donation for the technology development and support on the website. The services access is not linked to any continued donation or payment and we are sure that that traders who opt to access for these services have a profitable engagement.
We had some service outages on September 11 and 12 related to hardware failure. These are nearly completely fixed. For information.
|
AuthorAbnash Singh, Am a Trader helping small traders to realize their dreams. Archives
October 2017
Categories
All
|
 RSS Feed